Experimental free energy surface reconstruction from single-molecule force spectroscopy using Jarzynski's equality
- PMID: 17930869
- PMCID: PMC2682736
- DOI: 10.1103/PhysRevLett.99.068101
Experimental free energy surface reconstruction from single-molecule force spectroscopy using Jarzynski's equality
Abstract
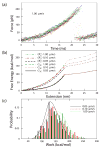
We used the atomic force microscope to manipulate and unfold individual molecules of the titin I27 domain and reconstructed its free energy surface using Jarzynski's equality. The free energy surface for both stretching and unfolding was reconstructed using an exact formula that relates the nonequilibrium work fluctuations to the molecular free energy. In addition, the unfolding free energy barrier, i.e., the activation energy, was directly obtained from experimental data for the first time. This Letter demonstrates that Jarzynski's equality can be used to analyze nonequilibrium single-molecule experiments, and to obtain the free energy surfaces for molecular systems, including interactions for which only nonequilibrium work can be measured.
Figures


Comment in
-
Comment on "experimental free energy surface reconstruction from single-molecule force spectroscopy using Jarzynski's equality".Phys Rev Lett. 2008 Jan 11;100(1):019801; discussion 019802. doi: 10.1103/PhysRevLett.100.019801. Epub 2008 Jan 10. Phys Rev Lett. 2008. PMID: 18232836 No abstract available.
Similar articles
-
Velocity convergence of free energy surfaces from single-molecule measurements using Jarzynski's equality.Phys Rev E Stat Nonlin Soft Matter Phys. 2009 Apr;79(4 Pt 1):041912. doi: 10.1103/PhysRevE.79.041912. Epub 2009 Apr 10. Phys Rev E Stat Nonlin Soft Matter Phys. 2009. PMID: 19518261
-
Temperature and chemical denaturant dependence of forced unfolding of titin I27.J Phys Chem B. 2009 Aug 6;113(31):10845-8. doi: 10.1021/jp9002356. J Phys Chem B. 2009. PMID: 19719273 Free PMC article.
-
Mechanical unfolding of a titin Ig domain: structure of transition state revealed by combining atomic force microscopy, protein engineering and molecular dynamics simulations.J Mol Biol. 2003 Jul 18;330(4):867-77. doi: 10.1016/s0022-2836(03)00618-1. J Mol Biol. 2003. PMID: 12850153
-
Atomic force microscopy and other scanning probe microscopies.Curr Opin Chem Biol. 1998 Oct;2(5):579-84. doi: 10.1016/s1367-5931(98)80086-0. Curr Opin Chem Biol. 1998. PMID: 9818182 Review.
-
Pulling single molecules of titin by AFM--recent advances and physiological implications.Pflugers Arch. 2008 Apr;456(1):101-15. doi: 10.1007/s00424-007-0389-x. Epub 2007 Dec 6. Pflugers Arch. 2008. PMID: 18058125 Review.
Cited by
-
Comparative energy measurements in single molecule interactions.Biophys J. 2008 Jul;95(1):419-25. doi: 10.1529/biophysj.107.127886. Epub 2008 Mar 28. Biophys J. 2008. PMID: 18375504 Free PMC article.
-
Single molecule force measurements of perlecan/HSPG2: A key component of the osteocyte pericellular matrix.Matrix Biol. 2016 Mar;50:27-38. doi: 10.1016/j.matbio.2015.11.001. Epub 2015 Nov 4. Matrix Biol. 2016. PMID: 26546708 Free PMC article.
-
Extracting Kinetic and Stationary Distribution Information from Short MD Trajectories via a Collection of Surrogate Diffusion Models.J Chem Theory Comput. 2009 Jan 1;5(1):47-58. doi: 10.1021/ct800282a. J Chem Theory Comput. 2009. PMID: 20046947 Free PMC article.
-
Experimental demonstration of generalized quantum fluctuation theorems in the presence of coherence.Sci Adv. 2025 May 30;11(22):eadq6014. doi: 10.1126/sciadv.adq6014. Epub 2025 May 30. Sci Adv. 2025. PMID: 40446028 Free PMC article.
-
Overcoming dissipation in the calculation of standard binding free energies by ligand extraction.J Comput Chem. 2013 Oct 15;34(27):2360-71. doi: 10.1002/jcc.23398. Epub 2013 Aug 26. J Comput Chem. 2013. PMID: 24038118 Free PMC article.
References
Publication types
MeSH terms
Substances
Grants and funding
LinkOut - more resources
Full Text Sources
