

Crossbridge properties during force enhancement by slow stretching in single intact frog muscle fibres
- PMID: 17932153
- PMCID: PMC2375483
- DOI: 10.1113/jphysiol.2007.141440
Crossbridge properties during force enhancement by slow stretching in single intact frog muscle fibres
Abstract
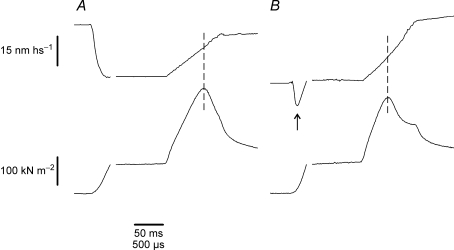
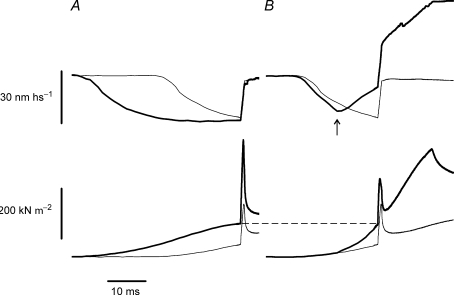
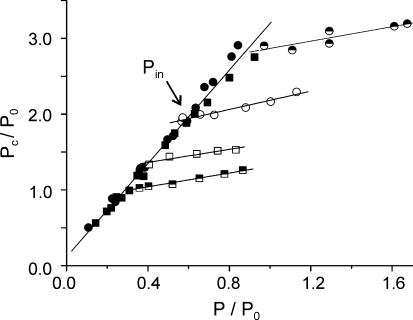
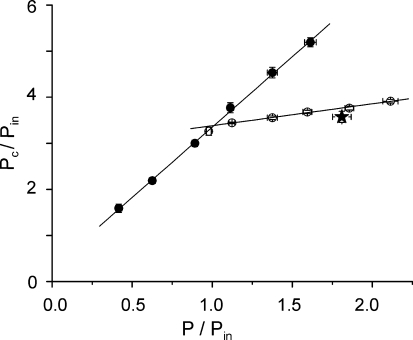
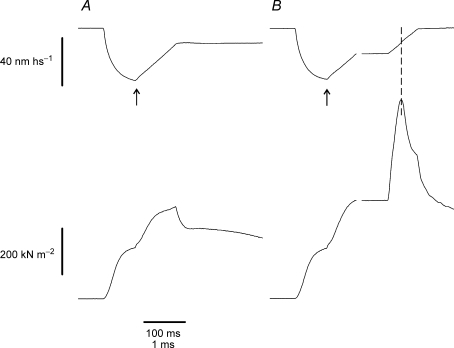
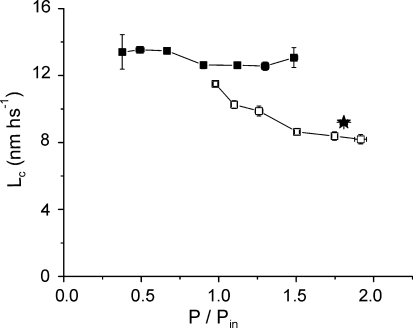
The mechanism of force enhancement during lengthening was investigated on single frog muscle fibres by using fast stretches to measure the rupture tension of the crossbridge ensemble. Fast stretches were applied to one end of the activated fibre and force responses were measured at the other. Sarcomere length was measured by a striation follower device. Fast stretching induced a linear increase of tension that reached a peak and fell before the end of the stretch indicating that a sudden increase of fibre compliance occurred due to forced crossbridge detachment induced by the fast loading. The peak tension (critical tension, Pc) and the sarcomere length needed to reach Pc (critical length, Lc) were measured at various tensions during the isometric tetanus rise and during force enhancement by slow lengthening. The data showed that Pc was proportional to the tension generated by the fibre under both isometric and slow lengthening conditions. However, for a given tension increase, Pc was 6.5 times greater during isometric than during lengthening conditions. Isometric critical length was 13.04 +/- 0.17 nm per half-sarcomere (nm hs(-1)) independently of tension. During slow lengthening critical length fell as the force enhancement increased. For 90% enhancement, Lc reduced to 8.19 +/- 0.039 nm hs(-1). Assuming that the rupture force of the individual crossbridge is constant, these data indicate that the increase of crossbridge number during lengthening accounts for only 15.4% of the total force enhancement. The remaining 84.6% is accounted for by the increased mean strain of the crossbridges.
Figures
Similar articles
-
Crossbridge properties investigated by fast ramp stretching of activated frog muscle fibres.J Physiol. 2005 May 15;565(Pt 1):261-8. doi: 10.1113/jphysiol.2005.085209. Epub 2005 Mar 17. J Physiol. 2005. PMID: 15774512 Free PMC article.
-
Mechanism of force enhancement during stretching of skeletal muscle fibres investigated by high time-resolved stiffness measurements.J Muscle Res Cell Motil. 2013 Feb;34(1):71-81. doi: 10.1007/s10974-012-9335-4. Epub 2013 Jan 8. J Muscle Res Cell Motil. 2013. PMID: 23296372
-
The contractile response during steady lengthening of stimulated frog muscle fibres.J Physiol. 1990 Dec;431:141-71. doi: 10.1113/jphysiol.1990.sp018324. J Physiol. 1990. PMID: 2100305 Free PMC article.
-
Non-crossbridge stiffness in active muscle fibres.J Exp Biol. 2016 Jan;219(Pt 2):153-60. doi: 10.1242/jeb.124370. J Exp Biol. 2016. PMID: 26792325 Review.
-
Crossbridge and non-crossbridge contributions to force in shortening and lengthening muscle.Adv Exp Med Biol. 2010;682:207-21. doi: 10.1007/978-1-4419-6366-6_12. Adv Exp Med Biol. 2010. PMID: 20824528 Review.
Cited by
-
Mechanism of force enhancement during and after lengthening of active muscle: a temperature dependence study.J Muscle Res Cell Motil. 2012 Oct;33(5):313-25. doi: 10.1007/s10974-012-9307-8. Epub 2012 Jun 16. J Muscle Res Cell Motil. 2012. PMID: 22706970
-
Reversal of the myosin power stroke induced by fast stretching of intact skeletal muscle fibers.Biophys J. 2009 Dec 2;97(11):2922-9. doi: 10.1016/j.bpj.2009.09.018. Biophys J. 2009. PMID: 19948121 Free PMC article.
-
Mechanisms Of Residual Force Enhancement In Skeletal Muscle: Insights From Experiments And Mathematical Models.Biophys Rev. 2011 Dec;3(4):199-207. doi: 10.1007/s12551-011-0059-2. Biophys Rev. 2011. PMID: 22180761 Free PMC article.
-
A myosin-based mechanism for stretch activation and its possible role revealed by varying phosphate concentration in fast and slow mouse skeletal muscle fibers.Am J Physiol Cell Physiol. 2019 Dec 1;317(6):C1143-C1152. doi: 10.1152/ajpcell.00206.2019. Epub 2019 Sep 18. Am J Physiol Cell Physiol. 2019. PMID: 31532715 Free PMC article.
-
Force enhancement in lengthening contractions of cat soleus muscle in situ: transient and steady-state aspects.Physiol Rep. 2013 Jul;1(2):e00017. doi: 10.1002/phy2.17. Epub 2013 Jun 28. Physiol Rep. 2013. PMID: 24303106 Free PMC article.
References
-
- Abbott BC, Aubert XM. Changes in energy of a muscle during very slow stretch. Proc R Soc Lond B Biol Sci. 1951;139:104–107. - PubMed
-
- Bagni MA, Cecchi G, Cecchini E, Colombini B, Colomo F. Force responses to fast ramp stretches in stimulated frog skeletal muscle fibres. J Muscle Res Cell Motil. 1998;19:33–42. - PubMed
Publication types
MeSH terms
LinkOut - more resources
Full Text Sources
Research Materials
Miscellaneous