

Intracellular calcium changes in mice Leydig cells are dependent on calcium entry through T-type calcium channels
- PMID: 17932157
- PMCID: PMC2375479
- DOI: 10.1113/jphysiol.2007.137950
Intracellular calcium changes in mice Leydig cells are dependent on calcium entry through T-type calcium channels
Abstract
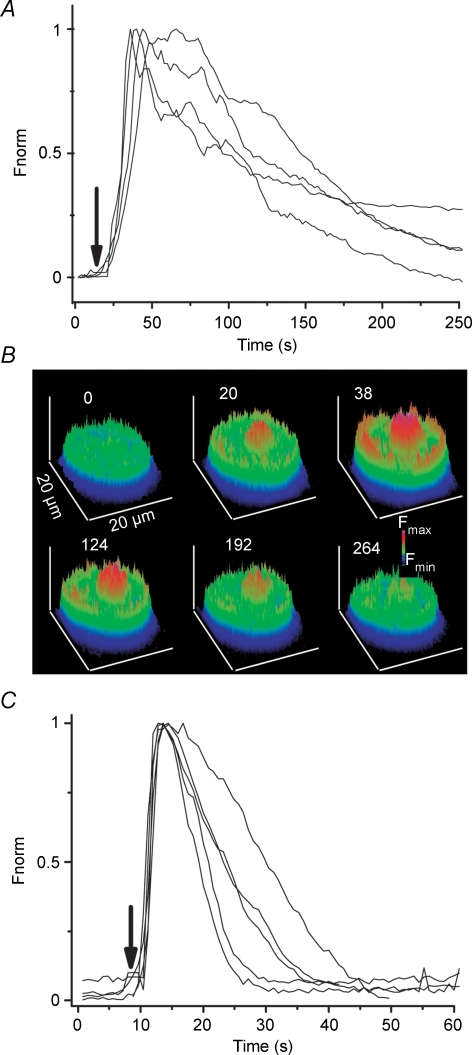
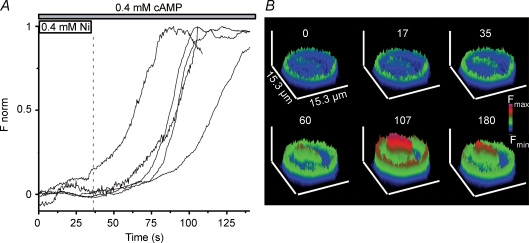
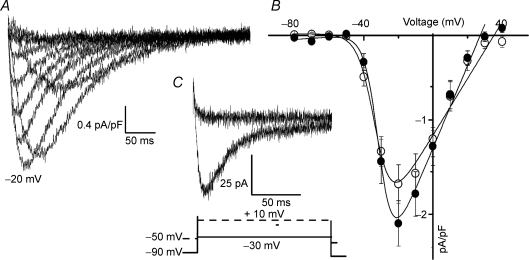
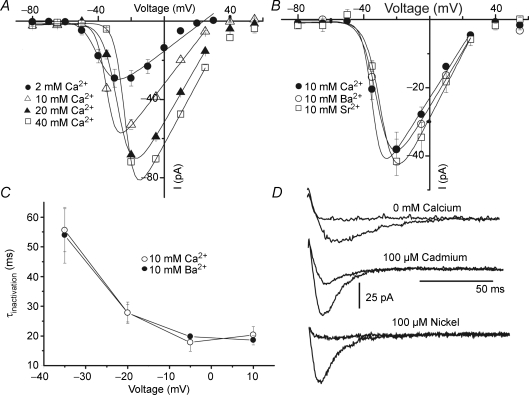
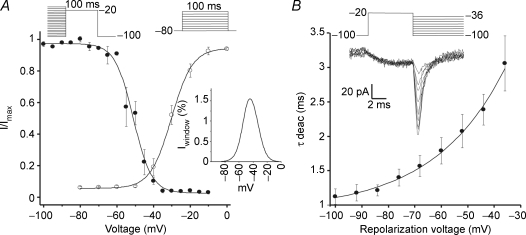
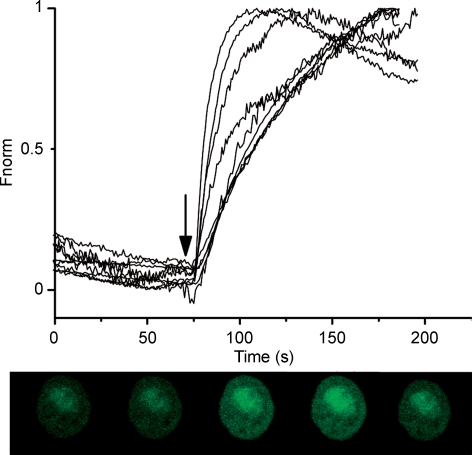
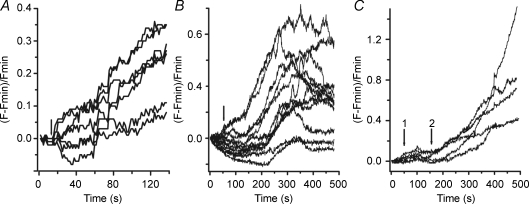
Luteinizing hormone (LH) regulates testosterone synthesis in Leydig cells by inducing an intracellular increase in cAMP concentration. LH also increases the intracellular calcium concentration ([Ca2+]i), dependent on the presence of Ca2+ in the extracellular medium ([Ca2+]e) for its effect. Despite these evidences, the identity of a pathway for calcium entry has remained elusive and the relationship between cAMP and [Ca2+]i has been questioned. Here we show that mice Leydig cells do have an inward Ca2+ current carried by T-type Ca2+ channels. In 10 mm [Ca2+]e, the currents start to be activated at -60 mV, reaching maximal amplitude of 1.8 +/- 0.3 pA pF(-1) at -20 mV. Currents were not modified by Ba2+ or Sr2+, were suppressed in Ca2+-free external solution, and were blocked by 100 microm nickel or 100 microm cadmium. The Ki for Ni2+ is 2.6 microm and concentrations of Cd2+ smaller than 50 microm have a very small effect on the currents. The calcium currents displayed a window centred at -40 mV. The half-voltage (V0.5) of activation is -30.3 mV, whereas the half-voltage steady-state inactivation is -51.1 mV. The deactivation time constant (taudeactivation) is around 3 ms at -35 mV. Confocal microscopy experiments with Fluo-3 loaded cells reveal that both LH and dibutyryl-cAMP (db-cAMP) increase [Ca2+]i. The db-cAMP induced calcium increase was dependent on Ca2+ influx since it was abolished by removal of extracellular Ca2+ and by 400 microm Ni2+. [Ca2+]i increases in regions close to the plasma membrane and in the cell nucleus. Similar effects are seen when Leydig cells are depolarized by withdrawing K+ from the extracellular solution. Altogether, our studies show that Ca2+ influx through T-type Ca2+ channels in the plasma membrane of Leydig cells plays a crucial role in the intracellular calcium concentration changes that follow binding of LH to its receptor.
Figures
Similar articles
-
Existence of calcium channels and intercellular couplings in the testosterone-secreting cells of the mouse.J Physiol. 1987 Dec;393:647-66. doi: 10.1113/jphysiol.1987.sp016846. J Physiol. 1987. PMID: 2451748 Free PMC article.
-
Whole cell calcium currents in acutely isolated olfactory bulb output neurons of the rat.J Neurophysiol. 1996 Mar;75(3):1138-51. doi: 10.1152/jn.1996.75.3.1138. J Neurophysiol. 1996. PMID: 8867124
-
Characterization of voltage-gated calcium currents in freshly isolated smooth muscle cells from rat tail main artery.Acta Physiol Scand. 2001 Nov;173(3):257-65. doi: 10.1046/j.1365-201X.2001.00907.x. Acta Physiol Scand. 2001. PMID: 11736688
-
A novel barium-sensitive calcium influx into rat astrocytes at low external potassium.Cell Calcium. 2000 Oct;28(4):247-59. doi: 10.1054/ceca.2000.0153. Cell Calcium. 2000. PMID: 11032780
-
L-type Ca2+ current as the predominant pathway of Ca2+ entry during I(Na) activation in beta-stimulated cardiac myocytes.J Physiol. 2000 Sep 15;527 Pt 3(Pt 3):455-66. doi: 10.1111/j.1469-7793.2000.00455.x. J Physiol. 2000. PMID: 10990533 Free PMC article.
Cited by
-
Regulation of testosterone synthesis in Leydig cells by ClC-2 chloride channel.Reproduction. 2025 Jul 18;170(2):e240432. doi: 10.1530/REP-24-0432. Print 2025 Aug 1. Reproduction. 2025. PMID: 40683311 Free PMC article.
-
Voltage-Gated T-Type Calcium Channel Modulation by Kinases and Phosphatases: The Old Ones, the New Ones, and the Missing Ones.Cells. 2023 Jan 31;12(3):461. doi: 10.3390/cells12030461. Cells. 2023. PMID: 36766802 Free PMC article. Review.
-
Calretinin Participates in Regulating Steroidogenesis by PLC-Ca2+-PKC Pathway in Leydig Cells.Sci Rep. 2018 May 9;8(1):7403. doi: 10.1038/s41598-018-25427-3. Sci Rep. 2018. PMID: 29743498 Free PMC article.
-
FBXO25-associated nuclear domains: a novel subnuclear structure.Mol Biol Cell. 2008 May;19(5):1848-61. doi: 10.1091/mbc.e07-08-0815. Epub 2008 Feb 20. Mol Biol Cell. 2008. PMID: 18287534 Free PMC article.
-
Inhibitory actions of mibefradil on steroidogenesis in mouse Leydig cells: involvement of Ca(2+) entry via the T-type Ca(2+) channel.Asian J Androl. 2010 Nov;12(6):807-13. doi: 10.1038/aja.2010.51. Epub 2010 Aug 9. Asian J Androl. 2010. PMID: 20694017 Free PMC article.
References
-
- Agoston A, Kunz L, Krieger A, Mayerhofer A. Two types of calcium channels in human ovarian endocrine cells: Involvement in steroidogenesis. J Clin Endocrinol Metab. 2004;89:4503–4512. - PubMed
-
- Carnio EC, Varanda WA. Calcium-activated potassium channels are involved in the response of mouse Leydig cells to human chorionic gonadotropin. Braz J Med Biol Res. 1995;28:813–824. - PubMed
-
- Chemin J, Traboulsie A, Lory P. Molecular pathways underlying the modulation of T-type calcium channels by neurotransmitters and hormones. Cell Calcium. 2006;40:121–134. - PubMed
Publication types
MeSH terms
Substances
LinkOut - more resources
Full Text Sources
Miscellaneous