. 2007 Oct 12;318(5848):279-83.
doi: 10.1126/science.1146113.

Fluorescence-force spectroscopy maps two-dimensional reaction landscape of the holliday junction

Affiliations

Fluorescence-force spectroscopy maps two-dimensional reaction landscape of the holliday junction

Sungchul Hohng et al. Science. .

Abstract

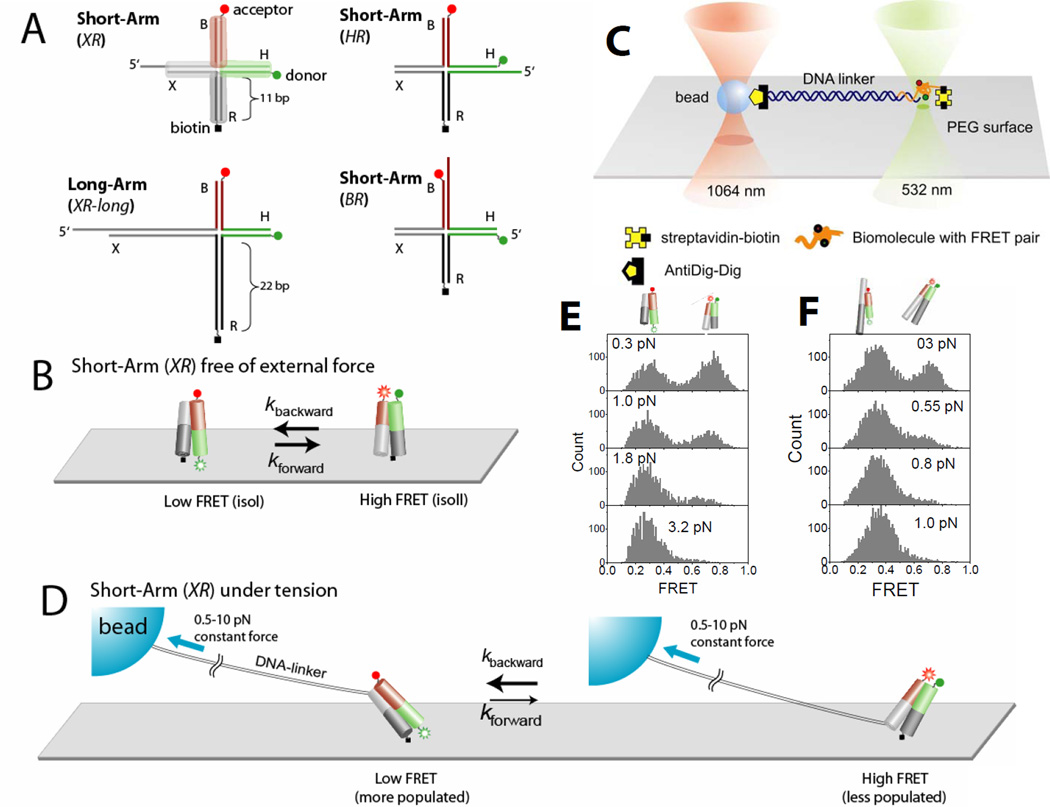
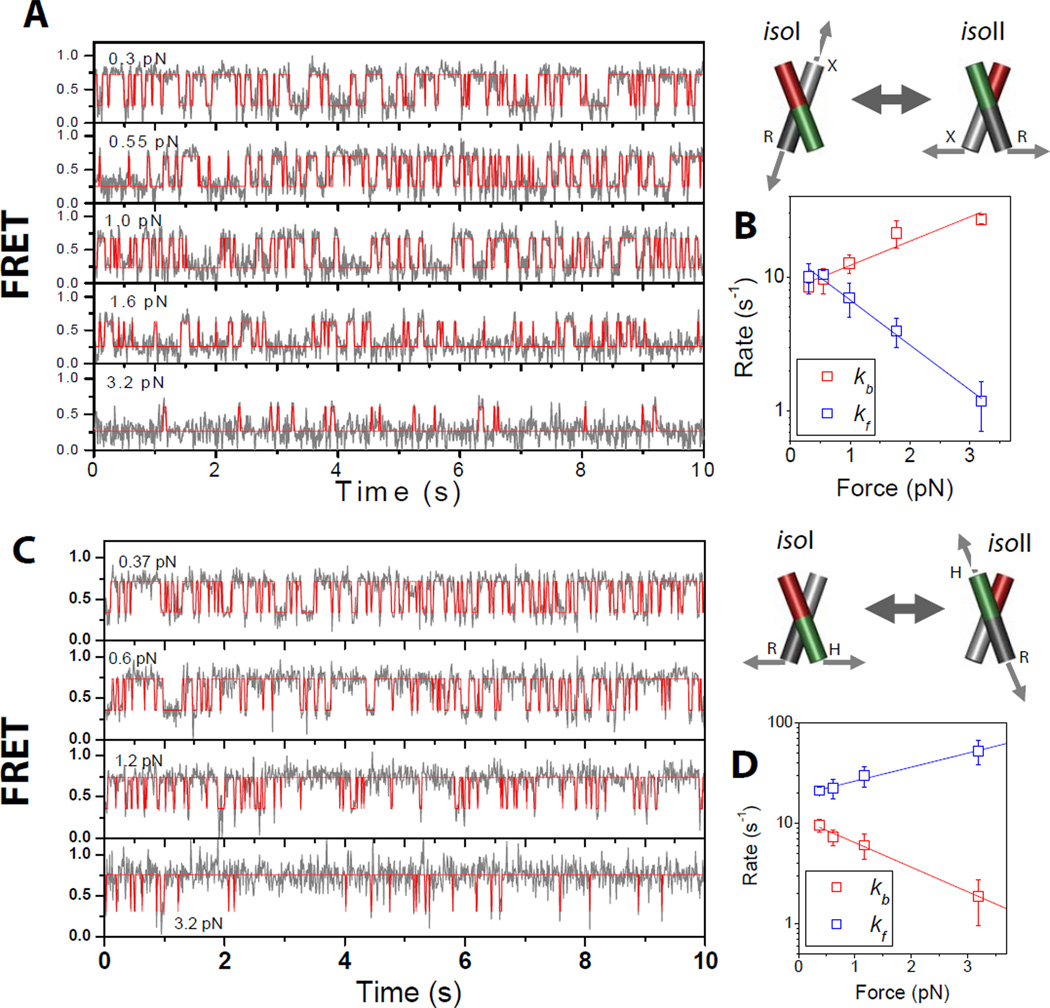
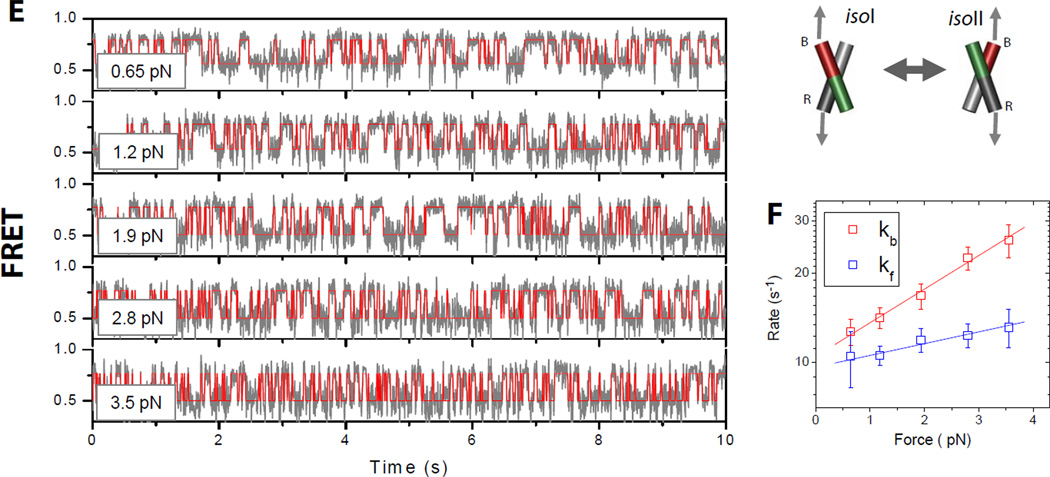
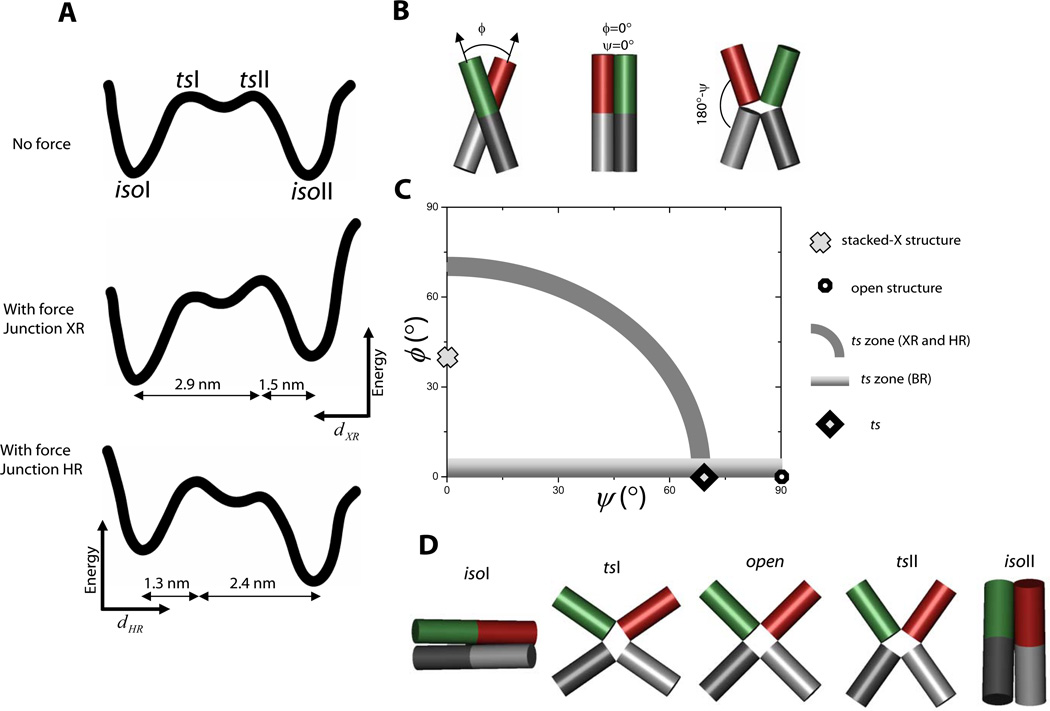
Despite the recent advances in single-molecule manipulation techniques, purely mechanical approaches cannot detect subtle conformational changes in the biologically important regime of weak forces. We developed a hybrid scheme combining force and fluorescence that allowed us to examine the effect of subpiconewton forces on the nanometer scale motion of the Holliday junction (HJ) at 100-hertz bandwidth. The HJ is an exquisitely sensitive force sensor whose force response is amplified with an increase in its arm lengths, demonstrating a lever-arm effect at the nanometer-length scale. Mechanical interrogation of the HJ in three different directions helped elucidate the structures of the transient species populated during its conformational changes. This method of mapping two-dimensional reaction landscapes at low forces is readily applicable to other nucleic acid systems and their interactions with proteins and enzymes.


Figures

Fig. 1
Fig. 1
Holliday junction constructs and experimental scheme. (A) The HJ species studied. Junction XR comprises four arms of 11 bp, termed B (red), H (green), R (dark gray) and X (gray). Cy3 and Cy5 fluorophores are terminally attached to H and B arms respectively, and the molecule is tethered to the surface through biotin attached to the end of the R arm. Stretching force is applied through the λ-DNA linker hybridized to the X arm. In junction XR-long the lengths of arms R and X are increased to 21 bp. In junction HR the λ-DNA linker is hybridized to the H arm. In junctions HR and BR the λ-DNA linker is hybridized to the H and B arms respectively. (B) Junction XR is known to alternate between two different stacking conformers, isoI (Low FRET) and isoII (High FRET) with similar populations in both states. (C) A surface-immobilized biomolecule with FRET labeling is connected to a trapped bead via a long DNA linker. The linker DNA spatially separates the confocal beam (532 nm) from the trapping beam (1064 nm) such that enhanced photobleaching and an overwhelming background signal induced by the intense trapping laser are avoided. To apply force, the surface immobilized molecule was moved relative to the trapped bead. The confocal beam was programmed to follow the motion of the molecule using the mapping generated between sample scanning and beam scanning (Fig. S6). (D) Force is expected to bias the junction XR to isoI which possesses a larger separation between the two tether points than isoII. (E) FRET histograms of a single junction XR as a function of force. (F) FRET histograms of a single junction XR-long as a function of force.
Figure 2
Figure 2
Conformer exchange dynamics of the HJ as a function of applied force. (A) FRET time traces (gray lines) of a single junction XR molecule at different forces. FRET efficiency is approximated by the acceptor intensity divided by the sum of the donor and acceptor intensities. Red lines are the most likely FRET trajectories generated via hidden Markov modeling. The imposed force (indicated on the top left of each plot) increases top to bottom. (B) Log-linear plot of rate constants of conformer exchange as a function of force. Rates of transitions from states isoII to isoI (kb red) and isoI to isoII (kfblue) are differentiated by color. Error bars represent standard deviations obtained from repeated measurements of the same molecule. From linear fitting, we found that the transition state is closer to isoII (1.8 nm) than to isoI (3.3 nm). (C) Same as (A) but for a single junction HR molecule. (D) Same as (B) for a single junction HR molecule. (E) Same as (A) and (C) but for a single junction BR molecule. (F) Same as (B) and (D) but for a single junction BR molecule.
Figure 2
Figure 2
Conformer exchange dynamics of the HJ as a function of applied force. (A) FRET time traces (gray lines) of a single junction XR molecule at different forces. FRET efficiency is approximated by the acceptor intensity divided by the sum of the donor and acceptor intensities. Red lines are the most likely FRET trajectories generated via hidden Markov modeling. The imposed force (indicated on the top left of each plot) increases top to bottom. (B) Log-linear plot of rate constants of conformer exchange as a function of force. Rates of transitions from states isoII to isoI (kb red) and isoI to isoII (kfblue) are differentiated by color. Error bars represent standard deviations obtained from repeated measurements of the same molecule. From linear fitting, we found that the transition state is closer to isoII (1.8 nm) than to isoI (3.3 nm). (C) Same as (A) but for a single junction HR molecule. (D) Same as (B) for a single junction HR molecule. (E) Same as (A) and (C) but for a single junction BR molecule. (F) Same as (B) and (D) but for a single junction BR molecule.
Figure 3
Figure 3
Mapping the reaction landscape and determining the transition state structure. (A) A proposed reaction landscape with two distinct transition states with nearly identical energies (top). In junction XRthe applied force would tilt the energy landscape toward isoI so that the transition state, tsII, nearer to isoII would become the state of highest energy along the entire coordinate (middle). The reaction coordinate here is the distance between the ends of X and R arms, dXRwhich increases to the left as shown. Similarly, in junction XRthe transition state, tsI, nearer to isoI would become the single transition state upon application of force. The reaction coordinate here is the distance between the ends of H and R arms, dHRwhich increases to the right. (B) Two angular coordinates ϕ and ψ define the global conformation of the HJ. (C) Two-dimensional conformational space of HJ conformations. The stacked-X structure and open structure are marked. The gray arc represents a zone that satisfies experimental constraints derived from XR and HR data, and the gradient zone is derived from BR data. The consensus location of the transition state is marked with a diamond. (D) Global structures of isoI, isoII and two transition states, tsI and tsII, plus an open structure.

References

    1. Bustamante C, Chemla YR, Forde NR, Izhaky D. Annu Rev Biochem. 2004;73:705. - PubMed
    1. Stryer L, Haugland RP. Proc. Natl. Acad. Sci., USA. 1967;58:719. - PMC - PubMed
    1. Ha T, et al. Proceedings of the National Academy of Sciences of the United States of America. 1996;93:6264. - PMC - PubMed
    1. Ha T. Methods. 2001;25:78. - PubMed
    1. Ashkin A, Dziedzic JM, Bjorkholm JE, Chu S. Optics Letters. 1986;11:288. - PubMed

Publication types