. 2007 Dec;8(4):484-96.
doi: 10.1007/s10162-007-0100-0. Epub 2007 Oct 12.

Measurement of the distribution of medial olivocochlear acoustic reflex strengths across normal-hearing individuals via otoacoustic emissions

Affiliations

Measurement of the distribution of medial olivocochlear acoustic reflex strengths across normal-hearing individuals via otoacoustic emissions

Bradford C Backus et al. J Assoc Res Otolaryngol. 2007 Dec.

Abstract

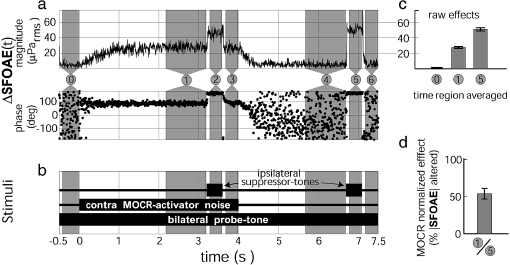
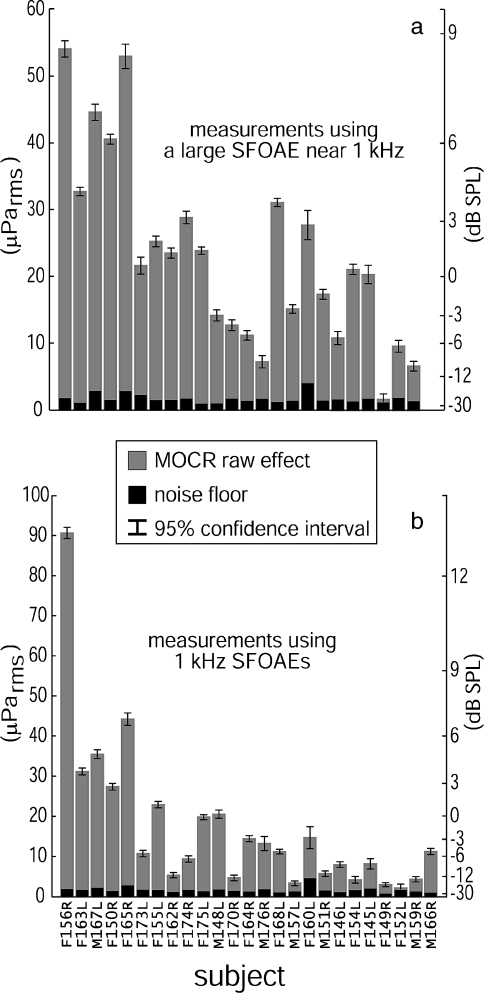
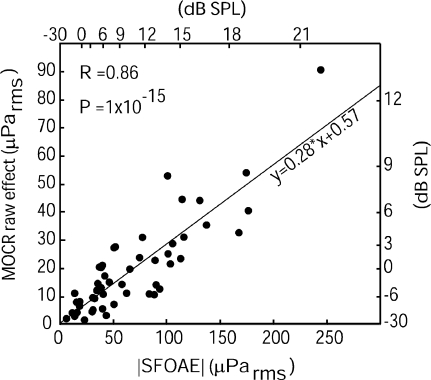
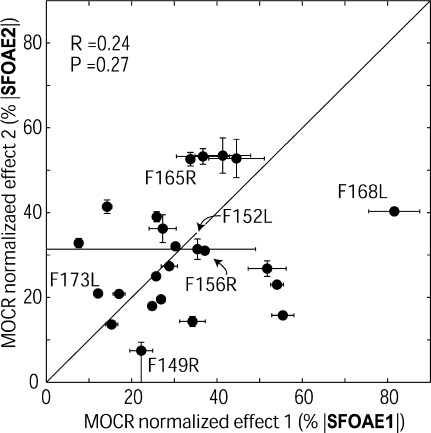
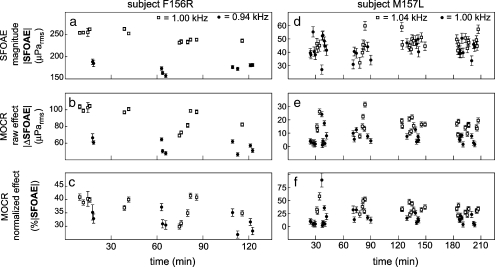
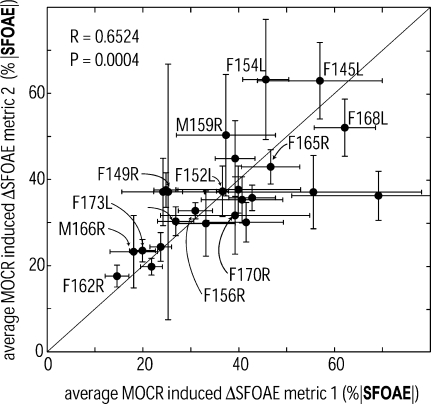
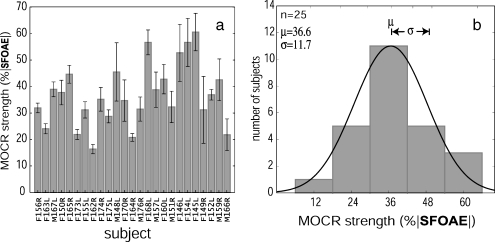
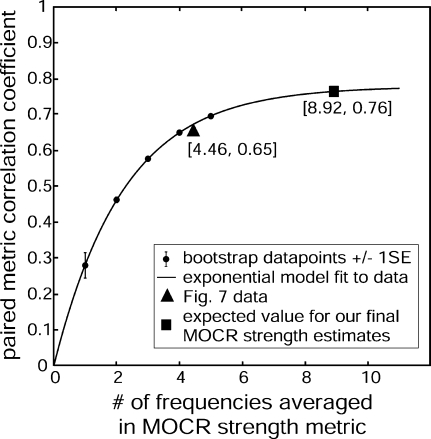
A clinical test for the strength of the medial olivocochlear reflex (MOCR) might be valuable as a predictor of individuals at risk for acoustic trauma or for explaining why some people have trouble understanding speech in noise. A first step in developing a clinical test for MOCR strength is to determine the range and variation of MOCR strength in a research setting. A measure of MOCR strength near 1 kHz was made across a normal-hearing population (N = 25) by monitoring stimulus-frequency otoacoustic emissions (SFOAEs) while activating the MOCR with 60 dB SPL wideband contralateral noise. Statistically significant MOCR effects were measured in all 25 subjects; but not all SFOAE frequencies tested produced significant effects within the time allotted. To get a metric of MOCR strength, MOCR-induced changes in SFOAEs were normalized by the SFOAE amplitude obtained by two-tone suppression. We found this "normalized MOCR effect" varied across frequency and time within the same subject, sometimes with significant differences between measurements made as little as 40 Hz apart or as little as a few minutes apart. Averaging several single-frequency measures spanning 200 Hz in each subject reduced the frequency- and time-dependent variations enough to produce correlated measures indicative of the true MOCR strength near 1 kHz for each subject. The distribution of MOCR strengths, in terms of SFOAE suppression near 1 kHz, across our normal-hearing subject pool was reasonably approximated by a normal distribution with mean suppression of approximately 35% and standard deviation of approximately 12%. The range of MOCR strengths spanned a factor of 4, suggesting that whatever function the MOCR plays in hearing (e.g., enhancing signal detection in noise, reducing acoustic trauma), different people will have corresponding differences in their abilities to perform that function.


Figures

FIG. 1
FIG. 1
Averaged response (a), stimulus timing (b), and analysis (c and d) from a single measurement of MOCR normalized effects. a Shows the average change (relative to region #0) in ear canal sound pressure at the probe-tone frequency, ΔSFOAE(t), caused by the contralateral noise. c Shows the magnitude of this response in three numbered time regions: 0 noise floor region, 1 MOCR response region A, 5 two-tone suppression response region (for SFOAE estimate). Bars 1 and 5 are from vector averages in these regions, and bar 0 is from the SD (see text). Error bars are 95% confidence intervals about the means. d Shows the MOCR normalized effect calculated from c, i.e., the ratio of the MOCR effect to the two-tone suppression effect with error bar = 1 SE. As shown in b, the probe-tone was a continuous, bilateral, 40 dB SPL, 1 kHz tone. The MOCR-activator was a contralateral, 60 dB SPL, wideband (100 Hz–10 kHz), 4 s, noise burst. Suppressor-tones were 60 dB SPL, 400 ms, ipsilateral tone bursts at 110 Hz below the probe-tone frequency. MOCR-activators and tone-suppressors were alternated in polarity on successive presentations. Subject F150R
FIG. 2
FIG. 2
Plots of the magnitudes of MOCR raw effects on SFOAEs (gray bars) relative to measurement noise (black bars) from two SFOAE frequencies measured in each of the 25 subjects. Although not all ears could be measured at all frequencies, all ears registered statistically significant (p < 0.006, i.e., the 95% confidence interval circles for the mean signal and noise do not overlap—see the “Methods” section) MOCR raw effects on at least one SFOAE near 1 kHz. a Shows the measurements of MOCR raw effects made using a large SFOAE (estimated from two-tone suppression) between 900 and 1,100 Hz for each subject (excluding 1 kHz). b Shows the MOCR raw effects measured in the same subjects using 1 kHz SFOAEs. The F or M prefix indicates male or female, L or R suffix indicates left or right ear; subject M166R was only measured at 1 kHz. The subjects are arranged left to right in decreasing order of the sum of the high-N native |SFOAEs| (the sums are not shown)
FIG. 3
FIG. 3
The plot of SFOAE amplitudes vs MOCR raw effects on those SFOAEs shows that most SFOAEs are changed by approximately 30% during contralateral MOCR activation with 60 dB SPL wideband noise. Data from the two high-N frequencies are both included. All error bars are smaller than, and obscured by, the points used to represent the data, indicating that the departures of the points from the linear relationship are not caused by measurement noise. Correlation (R = 0.86) was highly significant (p = 1e-15). The line represents a linear regression fit to the data
FIG. 4
FIG. 4
Two SFOAE-based measures of MOCR normalized effects for 24 subjects plotted against each other. The two measures were not significantly correlated (Pearson’s product-moment R = 0.24, p = 0.27) although they were made over the same time, in the same ear, and at nearby SFOAE frequencies. ‘SFOAE1’ used the 1 kHz SFOAE and ‘SFOAE2’ used a large SFOAE within 10% of 1 kHz. Error bars are ±1 SE; but most error bars are obscured by the data points. Subjects who are referred to in the text are labeled here and in subsequent graphs. Subjects F152L and F149R have asymmetric error bars that reach to zero because a statistically significant MOCR raw effect was not measured at one SFOAE frequency for these subjects (see Fig. 2). Subject M166R from Figure 2 is not included in this plot because that subject only had high-N data at 1 kHz
FIG. 5
FIG. 5
Repeated SFOAE measurements in the same subject show that small changes in frequency (10 s of Hz) can cause significant differences in normalized single-frequency MOCR effects. As expected, SFOAE magnitudes (a, d) and raw MOCR effects (b, e) can differ significantly over small differences in frequency (1.0 and 0.94 kHz in F156R; 1.0 and 1.04 kHz in M15L). Normalization reduced, but surprisingly did not remove, these differences (c, f). Each point is the average from four responses to 60 dB SPL contralateral noise. Error bars are 1 SE. The 1-kHz SFOAE amplitude of subject F156R varied significantly with time (i.e., across sessions) but this was not a general trend. Only four subjects had 1 kHz SFOAE magnitude-versus-time slopes that were statistically significant at the 0.05 level, and the slopes went in both directions
FIG. 6
FIG. 6
Two estimates of MOCR strength near 1 kHz for each of the 25 subjects plotted against each other. The two estimates are significantly correlated (R = 0.65, p = 0.0004) and spanned a range from 15% to 69%, indicating that there is statistically significant intersubject variation in MOCR strength near 1 kHz. Measure 1 was an average involving three to five (measurements had to be >2 SD above the noise floor magnitude to be included) SFOAEs at probe frequencies of 920, 960, 1,000, 1,040, and/or 1,080 Hz; measure 2 was an average involving three to six SFOAEs of 900, 940, 980, 1,020, 1,060, and/or 1,100 Hz. Error bars are ±1 SE
FIG. 7
FIG. 7
a Estimates of MOCR strength near 1 kHz for 25 normal-hearing subjects show the subject variations in efferent strength; error bars are ±1 SE. b Distribution of MOCR strengths near 1 kHz across subjects (mean = 36.6%, SD = 11.7%). The distribution is well approximated by a Gaussian (solid curve). MOCR activation with contralateral 60 dB SPL wideband noise generally suppressed SFOAEs near 1 kHz in a given subject by approximately 35% (range = 15–60%)
FIG. 8
FIG. 8
The plot shows how increasing the number of frequencies included in an SFOAE-based MOCR strength measure produces more subject-dependent (correlated) measures. Dots represent the mean bootstrapped values from the collected data for 25 subjects; error bars are ±1 SE, but all error bars are obscured except at N = 1. The curve is an exponential fit to these points described by the equation shown. The triangle shows the value from the grouping used in Figure 6. The square represents the extrapolated expected value when all the frequencies for each subject (that meet the SNR criteria) are combined as in Figure 7

References

    1. {'text': '', 'ref_index': 1, 'ids': [{'type': 'DOI', 'value': '10.1121/1.2434831', 'is_inner': False, 'url': 'https://doi.org/10.1121/1.2434831'}, {'type': 'PubMed', 'value': '17407896', 'is_inner': True, 'url': 'https://pubmed.ncbi.nlm.nih.gov/17407896/'}]}
    2. Backus BC. Bias due to noise in otoacoustic emission measurements. J. Acoust. Soc. Am. 121:1588–1603, 2007. - PubMed
    1. {'text': '', 'ref_index': 1, 'ids': [{'type': 'DOI', 'value': '10.1121/1.2169918', 'is_inner': False, 'url': 'https://doi.org/10.1121/1.2169918'}, {'type': 'PubMed', 'value': '16708947', 'is_inner': True, 'url': 'https://pubmed.ncbi.nlm.nih.gov/16708947/'}]}
    2. Backus BC, Guinan JJ Jr. Time-course of the human medial olivocochlear reflex. J. Acoust. Soc. Am. 119:2889–2904, 2006. - PubMed
    1. {'text': '', 'ref_index': 1, 'ids': [{'type': 'DOI', 'value': '10.1016/j.biopsych.2004.02.021', 'is_inner': False, 'url': 'https://doi.org/10.1016/j.biopsych.2004.02.021'}, {'type': 'PubMed', 'value': '15158424', 'is_inner': True, 'url': 'https://pubmed.ncbi.nlm.nih.gov/15158424/'}]}
    2. Bar-Haim Y, Henkin Y, Ari-Even-Roth D, Tetin-Schneider S, Hildesheimer M, Muchnik C. Reduced auditory efferent activity in childhood selective mutism. Biol. Psychiatry 55:1061–1068, 2004. - PubMed
    1. {'text': '', 'ref_index': 1, 'ids': [{'type': 'DOI', 'value': '10.1097/00129492-200105000-00013', 'is_inner': False, 'url': 'https://doi.org/10.1097/00129492-200105000-00013'}, {'type': 'PubMed', 'value': '11347638', 'is_inner': True, 'url': 'https://pubmed.ncbi.nlm.nih.gov/11347638/'}]}
    2. De Ceulaer G, Yperman M, Daemers K, Van Driessche K, Somers T, Offeciers FE, Govaerts PJ. Contralateral suppression of transient evoked otoacoustic emissions: normative data for a clinical test set-up. Otol. Neurotol. 22:350–355, 2001. - PubMed
    1. {'text': '', 'ref_index': 1, 'ids': [{'type': 'DOI', 'value': '10.1121/1.1903532', 'is_inner': False, 'url': 'https://doi.org/10.1121/1.1903532'}, {'type': 'PubMed', 'value': '4443490', 'is_inner': True, 'url': 'https://pubmed.ncbi.nlm.nih.gov/4443490/'}]}
    2. Geisler CD. Letter: hypothesis on the function of the crossed olivocochlear bundle. J. Acoust. Soc. Am. 56:1908–1909, 1974. - PubMed

Publication types

LinkOut - more resources