. 2007 Dec 14;282(50):36659-70.
doi: 10.1074/jbc.M705078200. Epub 2007 Oct 12.

Tuning of the outer hair cell motor by membrane cholesterol

Affiliations

Tuning of the outer hair cell motor by membrane cholesterol

Lavanya Rajagopalan et al. J Biol Chem. .

Abstract

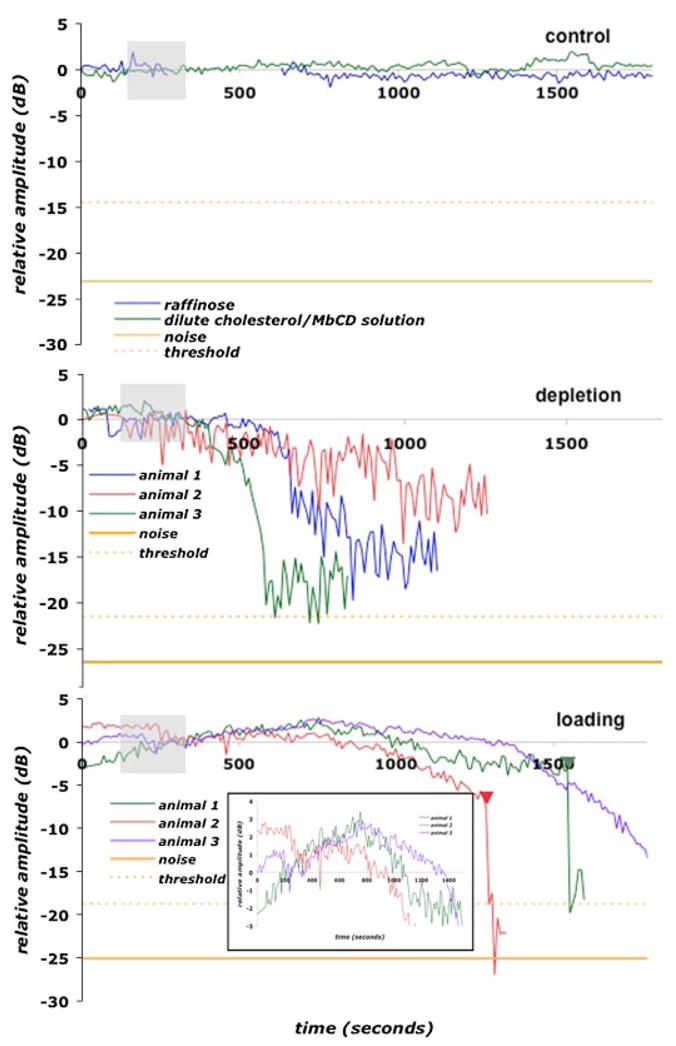
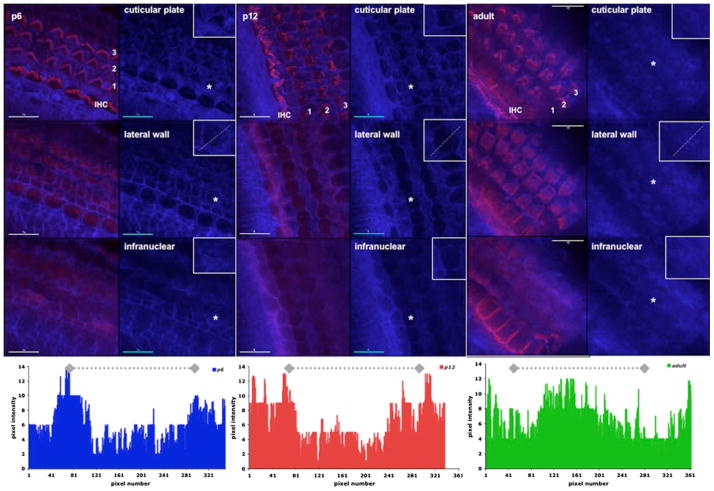
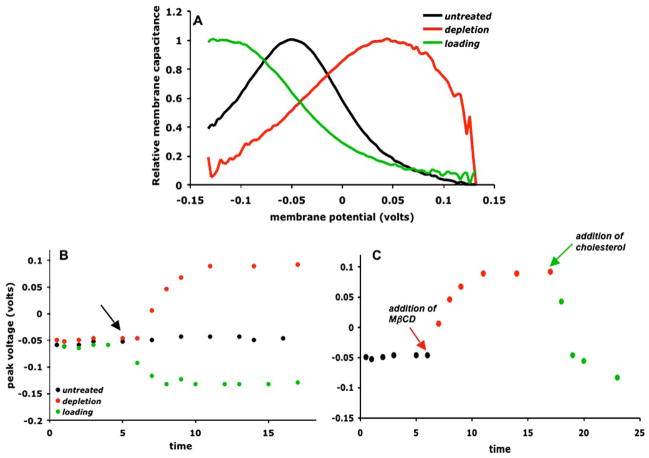
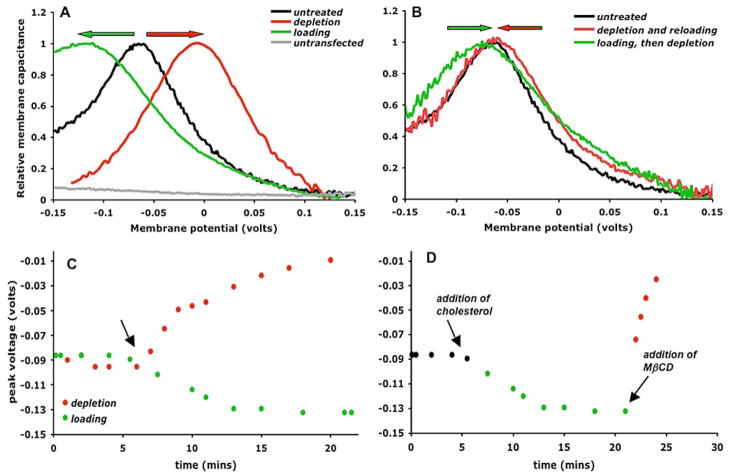
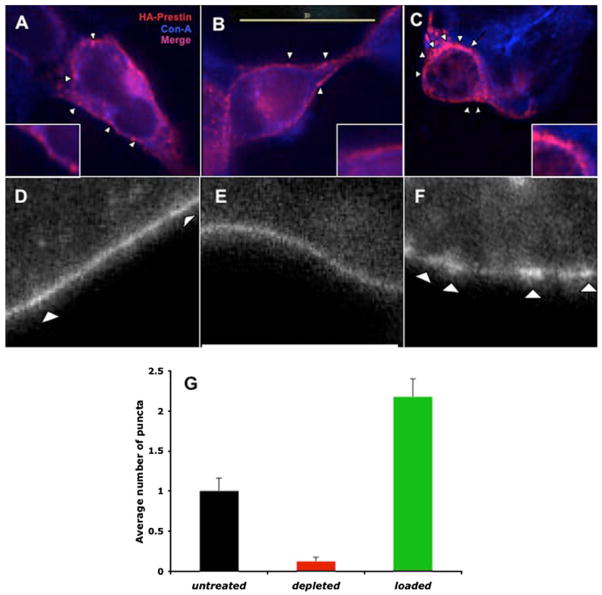
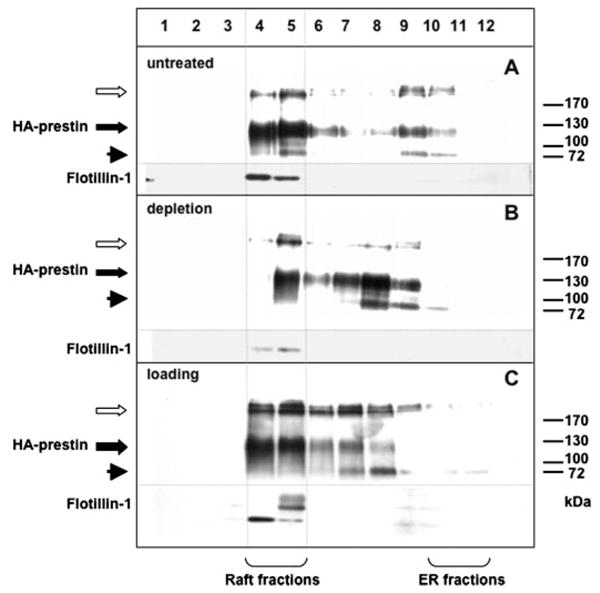
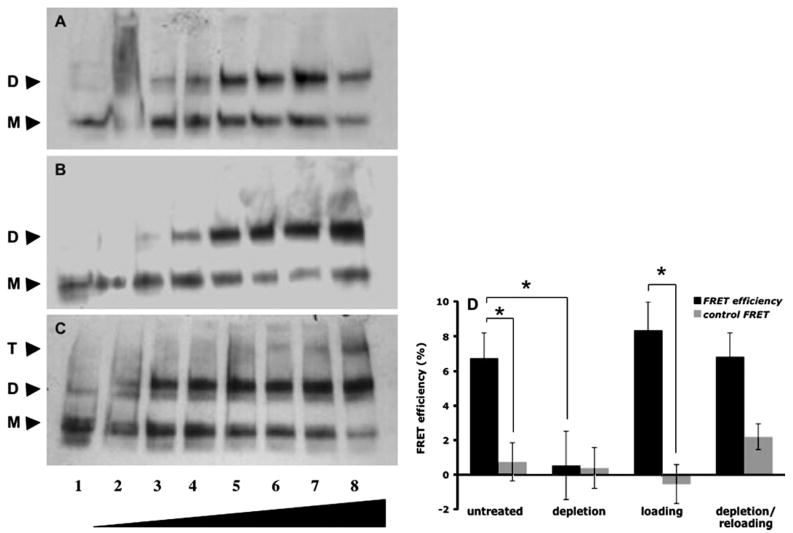
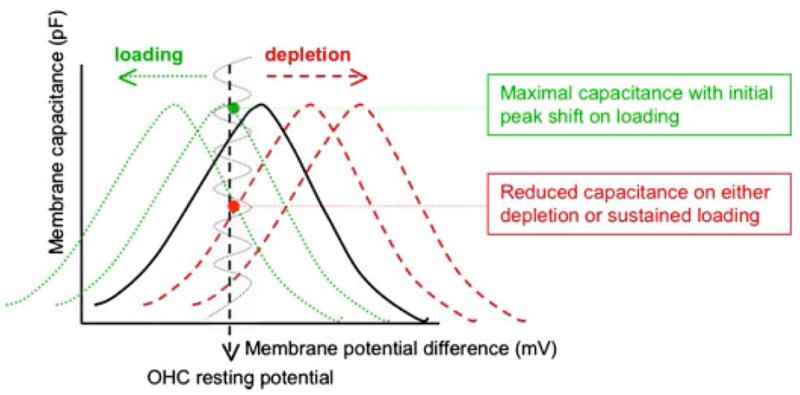
Cholesterol affects diverse biological processes, in many cases by modulating the function of integral membrane proteins. We observed that alterations of cochlear cholesterol modulate hearing in mice. Mammalian hearing is powered by outer hair cell (OHC) electromotility, a membrane-based motor mechanism that resides in the OHC lateral wall. We show that membrane cholesterol decreases during maturation of OHCs. To study the effects of cholesterol on hearing at the molecular level, we altered cholesterol levels in the OHC wall, which contains the membrane protein prestin. We show a dynamic and reversible relationship between membrane cholesterol levels and voltage dependence of prestin-associated charge movement in both OHCs and prestin-transfected HEK 293 cells. Cholesterol levels also modulate the distribution of prestin within plasma membrane microdomains and affect prestin self-association in HEK 293 cells. These findings indicate that alterations in membrane cholesterol affect prestin function and functionally tune the outer hair cell.


Figures

FIGURE 1
FIGURE 1. Effect of cochlear cholesterol loading/depletion on DPOAE amplitude
DPOAEs were measured continuously during the delivery of cholesterol, MβCD, or control solutions. The solid orange line indicates average noise, and the dotted orange line indicates the noise threshold, calculated as three S.D. above average noise. The gray box indicates time that the micropipette was inserted through the round window membrane and any middle ear fluid aspirated. During this time, the data demonstrate artifactual changes and changes in middle ear mechanics. After this time, the DPOAEs amplitudes are referenced to 0 db, and changes in the data represent changes in cochlear otoacoustic emissions. Top, injection of 200 mM raffinose (blue) or a dilute (10 mM) MβCD/cholesterol solution (green) caused no changes in DPOAE amplitudes after the micropipette was inserted into the round window and all middle ear fluid aspirated. Middle, cholesterol depletion (using 100 mM MβCD) caused progressive decreases in DPOAE amplitudes. Bottom, cholesterol loading (using 200 mM water-soluble cholesterol) caused initial slight (2–3 db) increases in DPOAE amplitudes, followed by a progressive decrease. The same traces, on a magnified y axis, are shown in the inset. DPOAE recordings during depletion showed higher noise levels (2.4 db S.D. from the average trend line) post-delivery, when compared with loading (0.34 db) and control treatments (0.2 db), or to intrinsic noise in the recordings before delivery (0.42, 0.89, and 0.31 for control, depletion, and loading treatments, respectively). Arrowheads indicate times at which the round window was perforated to eliminate DPOAEs.
FIGURE 2
FIGURE 2. OHC lateral wall cholesterol content decreases with maturation
Organ of Corti from P6 (left), P12 (middle), and adult (right) mice. Tissue was stained with phalloidin (red; to visualize actin in stereocilia) and filipin (blue, to label cholesterol) and imaged using deconvolution microscopy. Sections through the cuticular plate (top row), lateral wall (middle row), and infra-nuclear region (bottom row) show marked filipin staining in the OHC lateral wall in P6 and P12 versus adult mice. The single row of inner hair cells (IHC) and the three rows of outer hair cells (traces 1–3) are indicated in each set of panels. Individual OHCs shown magnified in the insets are highlighted with asterisks. Pixel intensities along the indicated line in each of these insets are plotted as bar graphs at the bottom. The gray bar in each of the graphs represents ~8 μm, the average diameter of a single OHC. Shown are representative data from a single experiment; the experiment was repeated two times.
FIGURE 3
FIGURE 3. Cholesterol levels affect Vpkc of nonlinear capacitance in outer hair cells
A, peak (Vpkc) of NLC is at about −0.050 V in control untreated OHCs (black trace). Vpkc shifts to depolarized voltages upon cholesterol depletion (100 μM MβCD; red trace) and hyperpolarized voltages upon cholesterol loading (1 mM water-soluble cholesterol; green trace). Traces have been normalized relative to peak capacitance. B, Vpkc begins to change within minutes after addition of MβCD (red circle) or water-soluble cholesterol (green circle). Untreated cells (black circle) show no change over a comparable time course. Shown are Vpkc readings from the same cell as a function of time post-treatment. C, reversibility of Vpkc shifts. Shown are changes in Vpkc of a single patched cell upon depletion of cholesterol (red circle), followed by loading (green circle). Arrows indicate time of treatment in B and C. Shown are representative data from single cells; sample sizes are indicated in Table 1.
FIGURE 4
FIGURE 4. Cholesterol affects membrane capacitance of HEK 293 cells expressing prestin
A, Vpkc is at about −0.070 V in untreated cells (black trace). The Vpkc shifts to depolarized voltages upon cholesterol depletion (10 mM MβCD; red trace, red arrow) and hyperpolarized voltages upon cholesterol loading (10 mM water-soluble cholesterol; green trace, green arrow). Linear capacitance from an untransfected cell is shown for comparison (gray trace). B, effect of cholesterol levels on Vpkc shifts is reversible. Upon cholesterol depletion and reloading (red trace, red arrow) the Vpkc shifts back to a normal voltage. Similarly, upon cholesterol loading followed by depletion (green trace, green arrow), the Vpkc shifts back from hyperpolarized voltages to a normal value. Shown are representative average traces from single cells. Traces have been normalized to the capacitance at Vpkc. C, Vpkc changes after addition of MβCD (red circle) or water-soluble cholesterol (green circle). Shown are Vpkc readings from the same cell as a function of time post-treatment. D, reversibility of Vpkc shifts. Shown are changes in Vpkc of a single patched cell upon addition of cholesterol (red circle), followed by depletion (green circle). Arrows indicate time of treatment in C and D. Shown are representative data from single cells; sample sizes are indicated in Table 1.
FIGURE 5
FIGURE 5. Prestin is expressed in punctate foci in the HEK 293 membrane
Immunofluorescence staining of HA-prestin-transfected HEK 293 cells was used to visualize membrane distribution and localization of prestin. Representative deconvolution images (A–C) show prestin fluorescence (red) coincides with that of concanavalin- A (blue), a membrane marker. Enlarged images of the membrane are shown in insets. The bottom row (DF) contains representative enlarged confocal images of the membrane of prestin-YFP transfected HEK 293 cells, showing puncta (arrowheads). A and D, HEK 293 cells transfected with prestin show punctate foci (arrowheads) of prestin fluorescence in the membrane. B and E, depletion of cholesterol by 10 mM MβCD causes a less punctate, more uniform prestin labeling. C and F, loading excess cholesterol (10 mM water-soluble cholesterol) causes an increase in number of punctate foci. G, quantification of number of foci. Puncta in membrane regions were quantified as described using multiple images of membrane segments from different batches of treated HEK 293 cells. The graph represents average number of puncta per 10.5 μm of membrane, calculated from several live confocal images of membrane segments. Images used in puncta quantification are shown in supplemental Fig. 3; time-lapse images of a single transfected cell over the course of depletion and loading treatments are shown in supplemental Fig. 4.
FIGURE 6
FIGURE 6. Cholesterol affects membrane distribution of prestin
A, sucrose density gradient fractionation of membranes from HA-prestin-transfected HEK 293 cells. HA-prestin colocalizes with flotillin-1, a membrane microdomain marker (lanes 4 and 5). B, depletion of cholesterol with 10 mM MβCD causes a redistribution of HA-prestin into heavier membrane fractions. C, cholesterol enrichment (10 mM water-soluble cholesterol) enhances colocalization into membrane microdomain fractions. The arrowhead and black arrow point to unglycosylated and glycosylated monomeric prestin, respectively. The white arrow points to oligomeric species. Shown are representative data from a single experiment; the experiment was repeated at least three times.
FIGURE 7
FIGURE 7. Effect of cholesterol on prestin self-association
A, HA-prestin is cross-linked as dimers and oligomers with increasing concentrations (0, 0.078, 0.16, 0.32, 0.65, 1.25, 2.5, and 5 mM in lanes 1–8, respectively) of the membrane-impermeable agent BS3. B, cholesterol depletion using 10 mM MβCD causes a reduction in cross-linking; higher concentrations of BS3 are required for dimer formation. C, cholesterol loading using 10mM water-soluble cholesterol causes an increase in cross-linking; oligomer bands appear even in the absence of cross-linker (lane 1). M, D, and T denote monomeric, dimeric, and trimeric prestin bands, respectively (based on molecular weight). D, acceptor photobleach FRET measurements to evaluate prestin self-association in live HEK 293 cells. Acceptor photobleach FRET efficiencies (■) and control (unbleached) FRET values (■) were measured from untreated (n = 22), cholesterol-depleted (n = 20), cholesterol-loaded (n = 16), and depleted and reloaded (n = 23) prestin-expressing HEK cells. Statistical significance (in comparison to control FRET for each treatment) is represented; *, p < 0.05. Shown are representative data from a single experiment; the experiment was repeated at least three times.
FIGURE 8
FIGURE 8. Schematic representation of correlation between NLC peak shifts and electromotility
The nonlinear capacitance of untreated OHCs has a peak at about −0.050 V, slightly depolarized from the resting potential of the cell. The corresponding capacitance in the operating range (receptor potential) of the cell (indicated by gray box and sinusoidal wave) is therefore slightly sub-maximal. Upon depletion, the peak shifts further away from this operating range, resulting in a progressive reduction in capacitance in this range. Upon loading, the peak initially shifts into the operating range, resulting in small increase in capacitance, and then shifts beyond the operating range resulting in a decrease of capacitance in the range. Electromotility and otoacoustic emissions may be presumed to follow the same pattern.

Similar articles

Cited by

References

    1. Boesze-Battaglia K, Albert AD. J Biol Chem. 1990;265:20727–20730. - PubMed
    1. Albert AD, Boesze-Battaglia K. Prog Lipid Res. 2005;44:99–124. - PMC - PubMed
    1. Chattopadhyay A, Jafurulla M, Kalipatnapu S, Pucadyil TJ, Harikumar KG. Biochem Biophys Res Commun. 2005;327:1036–1041. - PubMed
    1. Scanlon SM, Williams DC, Schloss P. Biochemistry. 2001;40:10507–10513. - PubMed
    1. Hinzpeter A, Fritsch J, Borot F, Trudel S, Vieu DL, Brouillard F, Baudoin-Legros M, Clain J, Edelman A, Ollero M. J Biol Chem. 2007;282:2423–2432. - PubMed

Publication types