

Wavelength-dependent conformational changes in collagen after mid-infrared laser ablation of cornea
- PMID: 17933877
- PMCID: PMC2212698
- DOI: 10.1529/biophysj.107.114389
Wavelength-dependent conformational changes in collagen after mid-infrared laser ablation of cornea
Abstract
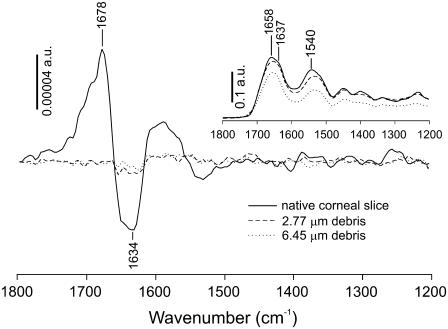
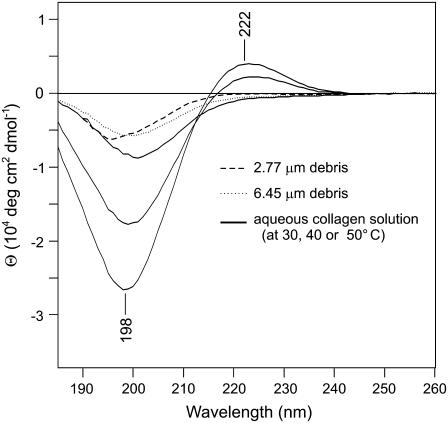
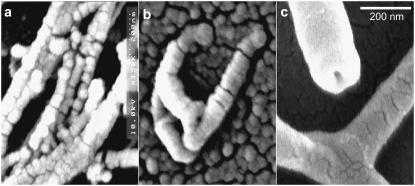
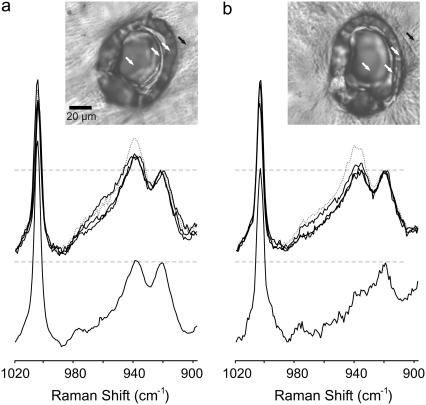
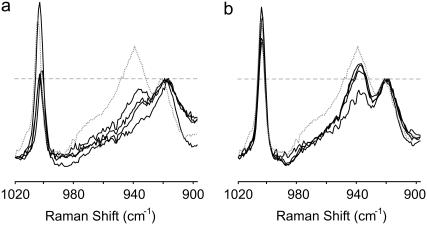
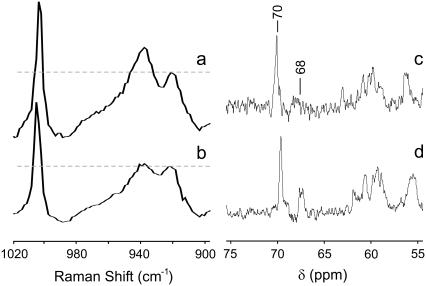
We ablated porcine corneas with a free electron laser tuned to either 2.77 or 6.45 microm, two matched wavelengths that predominantly target water and protein, respectively. The ejected nonvolatile debris and the crater left behind were examined by circular dichroism, Raman spectroscopy, and scanning electron microscopy to characterize the postablation conformation of collagen proteins. We found near-complete unfolding of collagen secondary and tertiary structure at either ablating wavelength. On the other hand, we found excess fibril swelling and evidence for excess cis-hydroxyproline in the 6.45-microm debris. These results support the hypothesis that the favorable ablative properties of protein-targeting wavelengths rest on selective heating of tissue proteins.
Figures
Similar articles
-
Wavelength-dependent collagen fragmentation during mid-IR laser ablation.Biophys J. 2006 Aug 15;91(4):1424-32. doi: 10.1529/biophysj.106.084616. Epub 2006 May 19. Biophys J. 2006. PMID: 16714345 Free PMC article.
-
Solid state ultraviolet laser (213 nm) ablation of the cornea and synthetic collagen lenticules.Lasers Surg Med. 1991;11(6):556-62. doi: 10.1002/lsm.1900110610. Lasers Surg Med. 1991. PMID: 1753850
-
Kinetics of a collagen-like polypeptide fragmentation after mid-IR free-electron laser ablation.Biophys J. 2008 Aug;95(3):1371-81. doi: 10.1529/biophysj.107.122002. Epub 2008 Apr 25. Biophys J. 2008. PMID: 18441025 Free PMC article.
-
Time-resolved, light scattering measurements of cartilage and cornea denaturation due to free electron laser radiation.J Biomed Opt. 2003 Apr;8(2):216-22. doi: 10.1117/1.1559996. J Biomed Opt. 2003. PMID: 12683847
-
Corneal and scleral collagens--a microscopist's perspective.Micron. 2001 Apr;32(3):261-72. doi: 10.1016/s0968-4328(00)00041-x. Micron. 2001. PMID: 11006506 Review.
Cited by
-
Application study of infrared free-electron lasers towards the development of amyloidosis therapy.J Synchrotron Radiat. 2022 Sep 1;29(Pt 5):1133-1140. doi: 10.1107/S1600577522007330. Epub 2022 Aug 12. J Synchrotron Radiat. 2022. PMID: 36073871 Free PMC article.
-
Mid-infrared free-electron laser tuned to the amide I band for converting insoluble amyloid-like protein fibrils into the soluble monomeric form.Lasers Med Sci. 2014 Sep;29(5):1701-7. doi: 10.1007/s10103-014-1577-5. Epub 2014 Apr 24. Lasers Med Sci. 2014. PMID: 24760285 Free PMC article.
-
Effect of mid-infrared free-electron laser irradiation on refolding of amyloid-like fibrils of lysozyme into native form.Protein J. 2012 Dec;31(8):710-6. doi: 10.1007/s10930-012-9452-3. Protein J. 2012. PMID: 23054332 Free PMC article.
-
Burn-related Collagen Conformational Changes in ex vivo Porcine Skin using Raman Spectroscopy.Sci Rep. 2019 Dec 16;9(1):19138. doi: 10.1038/s41598-019-55012-1. Sci Rep. 2019. PMID: 31844072 Free PMC article.
-
Raman spectroscopy in biomedicine - non-invasive in vitro analysis of cells and extracellular matrix components in tissues.Biotechnol J. 2013 Mar;8(3):288-97. doi: 10.1002/biot.201200163. Epub 2012 Nov 19. Biotechnol J. 2013. PMID: 23161832 Free PMC article. Review.
References
-
- Edwards, G., R. Logan, M. Copeland, L. Reinisch, J. Davidson, B. Johnson, R. Maciunas, M. Mendenhall, R. Ossoff, J. Tribble, J. Werkhaven, and D. O'Day. 1994. Tissue ablation by a free-electron laser tuned to the amide-II band. Nature. 371:416–419. - PubMed
-
- Edwards, G. S., R. H. Austin, F. E. Carroll, M. L. Copeland, M. E. Couprie, W. E. Gabella, R. F. Haglund, B. A. Hooper, M. S. Hutson, E. D. Jansen, K. M. Joos, D. P. Kiehart, I. Lindau, J. Miao, H. S. Pratisto, J. H. Shen, Y. Tokutake, A. F. G. van der Meer, and A. Xie. 2003. Free-electron-laser-based biophysical and biomedical instrumentation. Rev. Sci. Instrum. 74:3207–3245.
-
- Copeland, M. L., R. J. Maciunas, and G. S. Edwards. 1998. Chapter VII: use of the free-electron laser for metastatic brain tumors. In Neurosurgical Topics: Advanced Techniques in Central Nervous System Metastases. R. J. Maciunas, editor. The American Association of Neurological Surgeons, Park Ridge, IL. 113–121.
-
- Joos, K. M., J. H. Shen, D. J. Shetlar, and V. A. Casagrande. 2000. Optic nerve sheath fenestration with a novel wavelength produced by the free electron laser (FEL). Lasers Surg. Med. 27:191–205. - PubMed
-
- Vogel, A., and V. Venugopalan. 2003. Mechanisms of pulsed laser ablation of biological tissues. Chem. Rev. 103:577–644. - PubMed
Publication types
MeSH terms
Substances
LinkOut - more resources
Full Text Sources
