. 2008 Feb 15;94(4):1483-96.
doi: 10.1529/biophysj.107.111674. Epub 2007 Oct 12.

Investigating interactions mediated by the presynaptic protein bassoon in living cells by Foerster's resonance energy transfer and fluorescence lifetime imaging microscopy

Affiliations

Investigating interactions mediated by the presynaptic protein bassoon in living cells by Foerster's resonance energy transfer and fluorescence lifetime imaging microscopy

Mini Jose et al. Biophys J. .

Abstract

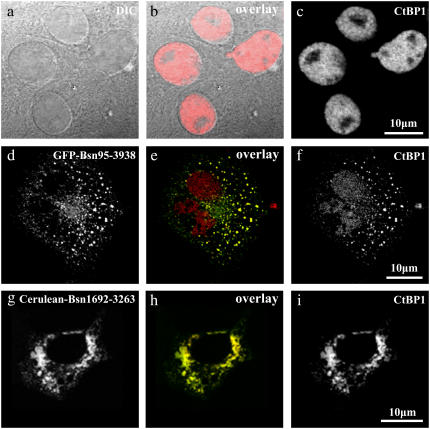
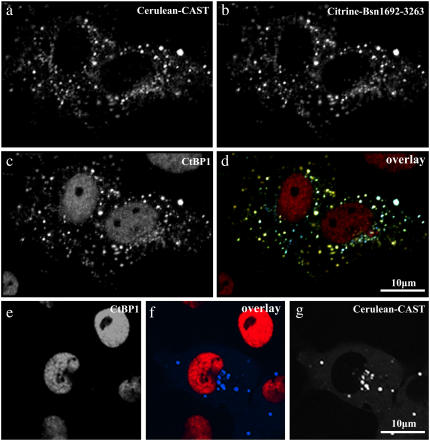
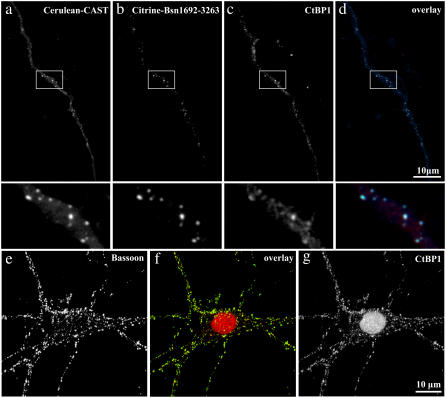
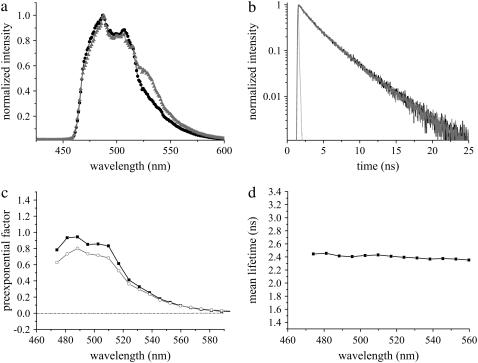
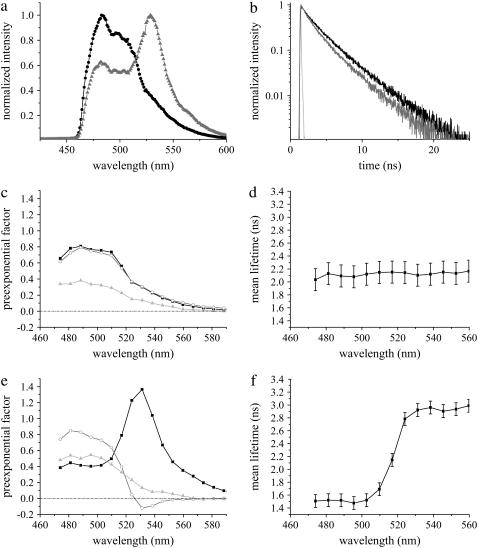
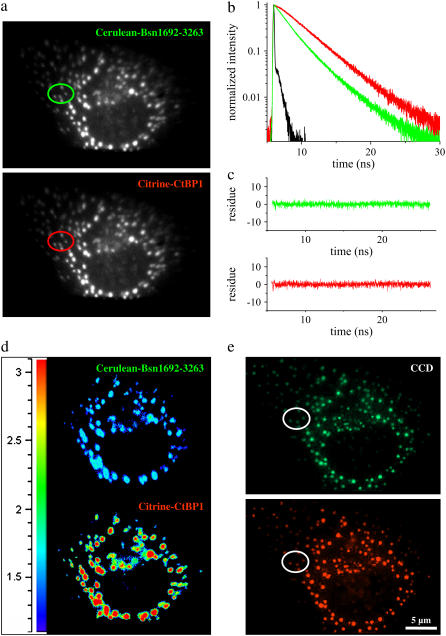
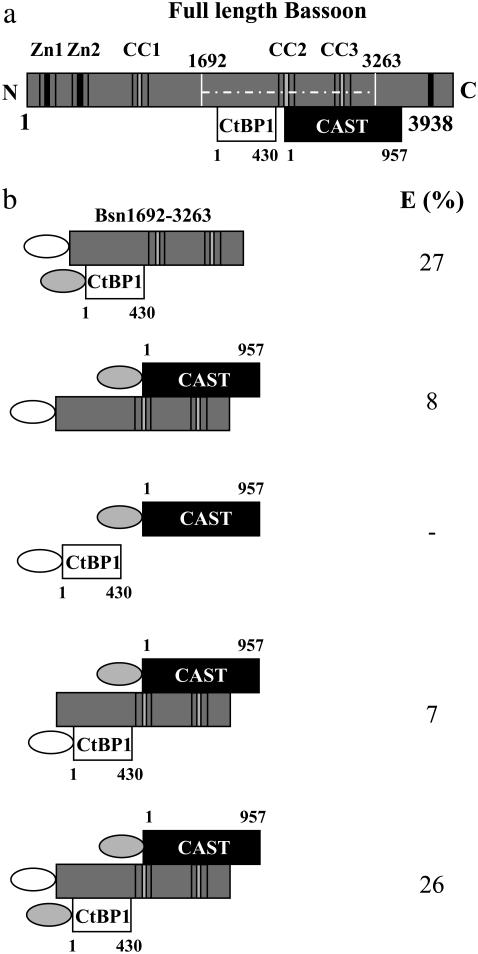
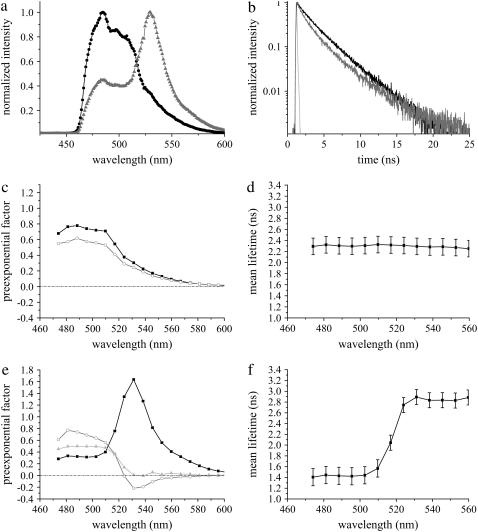
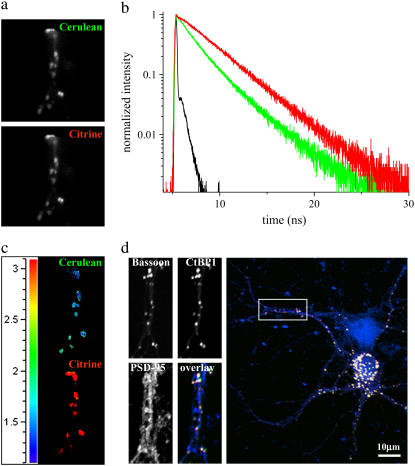
Neuronal synapses are highly specialized structures for communication between nerve cells. Knowledge about their molecular organization and dynamics is still incomplete. The large multidomain protein Bassoon plays a major role in scaffolding and organizing the cytomatrix at the active zone of neurotransmitter release in presynaptic boutons. Utilizing immunofluorescence techniques, we show that Bassoon is essential for corecruitment of its synaptic interaction partners, C-terminal binding protein 1/brefeldin A-dependent ADP-ribosylation substrate and CAZ-associated structural protein, into protein complexes upon heterologous expression in COS-7 cells. A combination of Foerster's resonance energy transfer and fluorescence lifetime imaging microscopy in the time domain was adopted to investigate the potential for the association of these proteins in the same complexes. A direct physical association between Bassoon and CtBP1 could also be observed at synapses of living hippocampal neurons. Simultaneous analysis of fluorescence decays of the donor and the acceptor probes along with their decay-associated spectra allowed a clear discrimination of energy transfer.


Figures

FIGURE 1
FIGURE 1
Immunofluorescence of CtBP1 in COS-7 cells in the absence and presence of Bassoon. (a–c) DIC images (a) together with immunostainings against CtBP1 (c) of the same cells showed clear nuclear localization of CtBP1. (d–i) Disruption of the nuclear localization of CtBP1 (f and i) in the presence of a Bassoon construct similar to the full length, namely, Bsn95-3938 (d) as well as in the presence of Bsn1692-3263 (g). In the overlay images (e and h), GFP-Bsn95-3938 and Cerulean-Bsn1692-3263 are shown in green, whereas endogenous CtBP1 stained with Alexa 594 is shown in red. Yellow denotes the degree of colocalization of these proteins. In both cases, CtBP1 was enriched outside the nucleus in contrast to its original localization pattern.
FIGURE 2
FIGURE 2
Corecruitment of Bassoon, CtBP1, and CAST to the same intracellular complexes in COS-7 cells (a–d). Cells were transfected with Cerulean-CAST (a) and Citrine-Bsn1692-3263 (b) and immunostained with antibodies against CtBP1 (c). The overlay of the trimeric complex is given in (d), where Cerulean-CAST, Citrine Bsn1692-3263, and CtBP1 are shown in green, red, and blue, respectively. (e–g) In the absence of Bassoon, the presence of CAST did not affect the nuclear localization of endogenous CtBP1. Cerulean-CAST (g) was observed to form cytosolic complexes, but no extranuclear recruitment of CtBP1 to these complexes was observed as visualized by Alexa 594 immunostainings (e).
FIGURE 3
FIGURE 3
Colocalization of Bassoon, CtBP1, and CAST to the same intracellular complex in hippocampal neurons (a–d). Cells were transfected with Cerulean-CAST (a) and Citrine-Bsn1692-3263 (b) and immunostained with anti-CtBP1-Alexa 594 (c). The overlay of the trimeric complex is given in d, where Cerulean-CAST, Citrine-Bsn1692-3263, and CtBP1 are shown in green, red, and blue, respectively. (e–g) In the presence of Bassoon (green), CtBP1 (red) colocalized with Bassoon-containing complexes at DIV 16, most of which are likely to represent synapses.
FIGURE 4
FIGURE 4
Fluorescence emission of Cerulean at 420 nm excitation in living COS-7 cells. (a) Comparison of fluorescence emission spectra of Cerulean alone (black) with coexpression of Cerulean and Citrine (shading). The fluorescence emission maximum for Cerulean was observed at 486 nm. A small Citrine component due to its high extinction coefficient was observed for the latter. (b) Fluorescence decay of Cerulean in the absence (black) and in the presence of Citrine (shading). IRF is shown in light shading. (c) DAS of Cerulean alone, which was unchanged in the presence of Citrine. Intensity decays were analyzed in 17 emission bands from 470 nm to 590 nm, and the preexponential factors of lifetimes τ1 (solid) and τ2 (shading) were plotted along the wavelength (Table 1). (d) Mean lifetimes of each emission band of Cerulean were plotted along the wavelength. Error bars are not shown due to their very small variability (<0.05 ns).
FIGURE 5
FIGURE 5
Fluorescence emission of Cerulean-Bsn1692-3263 in the absence and presence of Citrine-CtBP1 in living COS-7 cells. (a) Comparison of fluorescence emission spectra of Cerulean-Bsn1692-3263 (black) with the FRET sample (shading). A significant Citrine enhancement was observed in the presence of FRET. (b) Fluorescence decay of Cerulean-Bsn1692-3263 in the FRET sample (shading) was shorter compared to the control (black). IRF is shown in light shading. (c) DAS of control Cerulean-Bsn1692-3263. The preexponential factors of lifetimes τ1 (solid), τ2 (shading), and τ3 (light shading) were plotted along the wavelength (Table 1). (d) Mean lifetimes of each emission band were plotted along the wavelength for Cerulean-Bsn1692-3263. The variability between the cells is represented by error bars, which shows deviation due to the aggregating nature of the construct. (e) DAS of the FRET sample, Cerulean-Bsn1692-3263+Citrine-CtBP1. The preexponential factors of lifetimes τ1 (solid), τ2 (shading), and τ3 (light shading) (see Table 1) were plotted along the wavelength. Negative amplitudes were observed for τ2 at the acceptor emission maximum in the presence of FRET. (f) Mean lifetimes of each emission band were plotted with error bars along the wavelength for the FRET sample.
FIGURE 6
FIGURE 6
COS-7 cells coexpressing Cerulean-Bsn1692-3263 and Citrine-CtBP1 measured by the imaging detector. (a) The fluorescence emission was split into Cerulean-Bsn1692-3263 and Citrine-CtBP1 emission bands as shown. Selected ROIs are indicated by colored circles. (b) Fluorescence decays from corresponding ROIs marked in a. In the presence of energy transfer, Cerulean-Bsn1692-3263 (green) showed short fluorescence decay with a simultaneous rise for Citrine-CtBP1 (red). IRF is shown in black. (c) The quality of the individual fits (donor-green, acceptor-red) is shown by the distribution of the residues. (d) The lifetime distribution map of the FRET sample. The lifetimes increased significantly from the donor (top) to the acceptor (bottom), indicated by the transition from blue to red in the lifetime scale. (e) In the corresponding fluorescence images from the CCD camera, the green and red spots denote the donor and acceptor channels, respectively.
FIGURE 7
FIGURE 7
Combinatorial expressions of Bassoon, CAST, and CtBP1 in COS-7 cells. (a) Scheme illustrating the proposed binding regions for CtBP1 and CAST on Bassoon (11,14). The white lines indicate the projection of Bsn1692-3263 on the full-length construct. Zn denotes the zinc fingers and CC the coiled coil domains. (b) The different binding studies for determining the association of the molecules involved in the trimeric complex. The maximum FRET efficiency (E) was observed between Bassoon and CtBP1, which remained unchanged in the presence of CAST. Bassoon was essential for the formation of a trimeric complex of these proteins, without which no association between CtBP1 and CAST was observed. The data confirmed the simultaneous association of CtBP1 and CAST with the same Bassoon molecule. The white and shaded ellipses represent Cerulean and Citrine, respectively.
FIGURE 8
FIGURE 8
Fluorescence emission dynamics of Cerulean-Bsn1692-3263 in the absence (n = 8) and presence (n = 5) of Citrine-CtBP1 at synapses of living neurons at DIV 16. (a) Comparison of fluorescence emission spectra of Cerulean-Bsn1692-3263 (black) with the FRET sample (shading). A significant Citrine enhancement was observed in the presence of FRET. (b) Fluorescence decay of Cerulean-Bsn1692-3263 in the FRET sample (shading) was shorter than the control (black). IRF is shown in light shading. (c) DAS of Cerulean-Bsn1692-3263 in living neurons. The preexponential factors of lifetimes τ1 (solid) and τ2 (shading) (see Table 3) were plotted along the wavelength. The preexponential factors showed only positive values. (d) Mean lifetimes of each emission band of Cerulean-Bsn1692-3263 was plotted along the wavelength. No deviations along the spectra were observed. (e) DAS of the FRET sample, Cerulean-Bsn1692-3263+Citrine-CtBP1. The preexponential factors of lifetimes τ1 (solid), τ2 (shading), and τ3 (light shading) (Table 3) were plotted along the wavelength. Negative amplitudes were observed for τ2 at the acceptor emission maximum in the presence of FRET. (f) The plot of mean lifetimes showed significant deviations along the wavelength in the presence of FRET.
FIGURE 9
FIGURE 9
Processes of hippocampal neurons at DIV 16 coexpressing Cerulean-Bsn1692-3263 and Citrine-CtBP1, as measured by the imaging detector. (a) The fluorescence emission was split into Cerulean-Bsn1692-3263 and Citrine-CtBP1 emission bands as shown. (b) In the presence of energy transfer, Cerulean-Bsn1692-3263 (green) showed a short fluorescence decay with a simultaneous rise for Citrine-CtBP1 (red) with negative amplitudes for τ2. IRF is shown in black. (c) The lifetime distribution map of the FRET sample. The lifetimes increased significantly from the donor (top) to the acceptor (bottom), indicated by the transition from blue to red in the lifetime scale. (d) The imaged cells were fixed and immunostained with antibodies against the postsynaptic marker protein Sap90/PSD-95, which identified the colocalized complexes of Bassoon and CtBP1 to be presynapses. Confocal images were obtained from similar regions as measured by FLIM. In the overlay image, Cerulean-Bsn1692-3263, Citrine-CtBP1, and PSD-95 are shown in green, red, and blue, respectively.

Similar articles

Cited by

References

    1. Ballestrem, C., and B. Geiger. 2005. Application of microscope-based FRET to study molecular interactions in focal adhesions of live cells. Methods Mol. Biol. 294:321–334. - PubMed
    1. Jares-Erijman, E. A., and T. M. Jovin. 2003. FRET imaging. Nat. Biotechnol. 21:1387–1395. - PubMed
    1. Chen, Y., J. D. Mills, and A. Periasamy. 2003. Protein localization in living cells and tissues using FRET and FLIM. Differentiation. 71:528–541. - PubMed
    1. van Munster, E. B., and T. W. Gadella. 2005. Fluorescence lifetime imaging microscopy (FLIM). Adv. Biochem. Eng. Biotechnol. 95:143–175. - PubMed
    1. Nair, D. K., M. Jose, T. Kuner, W. Zuschratter, and R. Hartig. 2006. FRET-FLIM at nanometer spectral resolution from living cells. Opt. Express. 14:12217–12229. - PubMed

Publication types

MeSH terms