. 2007 Oct;19(10):3111-26.
doi: 10.1105/tpc.107.052621. Epub 2007 Oct 12.

Class-specific interaction of profilin and ADF isovariants with actin in the regulation of plant development

Affiliations

Class-specific interaction of profilin and ADF isovariants with actin in the regulation of plant development

Muthugapatti K Kandasamy et al. Plant Cell. 2007 Oct.

Abstract

Two ancient and highly divergent actin-based cytoskeletal systems have evolved in angiosperms. Plant genomes encode complex actin and actin binding protein (ABP) gene families, most of which are phylogenetically grouped into gene classes with distinct vegetative or constitutive and reproductive expression patterns. In Arabidopsis thaliana, ectopic expression of high levels of a reproductive class actin, ACT1, in vegetative tissues causes severe dwarfing of plants with aberrant organization of most plant organs and cell types due to a severely altered actin cytoskeletal architecture. Overexpression of the vegetative class actin ACT2 to similar levels, however, produces insignificant phenotypic changes. We proposed that the misexpression of the pollen-specific ACT1 in vegetative cell types affects the dynamics of actin due to its inappropriate interaction with endogenous vegetative ABPs. To examine the functionally distinct interactions among the major classes of actins and ABPs, we ectopically coexpressed reproductive profilin (PRF4) or actin-depolymerizing factor (ADF) isovariants (e.g., ADF7) with ACT1. Our results demonstrated that the coexpression of these reproductive, but not vegetative, ABP isovariants suppressed the ectopic ACT1 expression phenotypes and restored wild-type stature and normal actin cytoskeletal architecture to the double transgenic plants. Thus, the actins and ABPs appear to have evolved class-specific, protein-protein interactions that are essential to the normal regulation of plant growth and development.


Figures
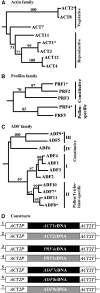
Figure 1.
Figure 1.
Arabidopsis Actin, Profilin, and ADF Families. (A) Actin tree showing two major classes of protein isovariants: vegetative and reproductive, which are encoded by three and five actin genes, respectively. (B) Profilin tree showing two ancient classes of protein isovariants, constitutive and pollen specific, which are encoded by three and two profilin genes, respectively. (C) ADF tree containing 11 proteins that are grouped into two major classes, constitutive and pollen/trichoblast specific, and encoded by four subclasses of genes (I to IV). The asterisks represent various protein isovariants that were overexpressed or misexpressed in this study. Branches with bootstrap values >50% are indicated in these neighbor-joining trees (see Methods). (D) Various actin (1, A2P:A1; 2, A2P:A2), profilin (3, A2P:P4; 4, A2P:P1), and ADF (5, A2P:ADF7; 6, A2P:ADF8; 7, A2P:ADF9) constructs used in the ectopic expression and suppression studies. The ACT2 expression cassette is shown in two white boxes [left box: promoter, 5′ untranslated region, leader exon, to AUG codon of second exon; right box: 3′ untranslated region and poly(A) sequences]. The black boxes represent cDNAs from reproductive class genes, and the gray boxes indicate vegetative or constitutive cDNAs.
Figure 2.
Figure 2.
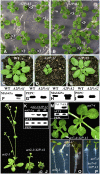
Effect of Ectopic Expression of ACT1 Protein on the Morphology of Plants. (A) Seventeen-day-old wild-type seedlings misexpressing pollen-specific ACT1. Dwarf plants expressing high levels of ACT1 are marked with arrowheads. (B) Seventeen-day-old wild-type seedlings overexpressing vegetative ACT2. Plants expressing high levels of ACT2 are marked with arrowheads. (C) Twenty-four-day-old wild-type control plant. (D) Twenty-four-day-old transgenic plant misexpressing ACT1. (E) Twenty-four-day-old transgenic plant overexpressing ACT2. (F) A protein gel blot showing a 45-kD ACT1 band in the transgenic (A2P:A1) but not wild-type sample. Probed with the reproductive anti-actin antibody MAb45a (see Methods). (G) A strip of the same blot in (F) probed with anti-PEP carboxylase (PEPC) antibody to show equal loading of total protein. (H) A protein gel blot showing a fourfold overexpression of ACT2 in the A2P:A2 transgenic plant compared with the wild type. Probed with the general anti-actin antibody MAbGPa (see Methods). (I) A strip of the same blot in (H) probed with anti-PEPC antibody to show equal loading of total protein. (J) Thirty-day-old act2-1 plant and mutant plants (d1 and d2) misexpressing ACT1. (K) Protein gel blot analysis of transgenic act2-1 mutant plants expressing different levels of ACT1. Note the absence of ACT1 in the act2-1 mutant. The bottom blot shows equal amount of PEPC in all samples. n, normal plant; d1 and d2, dwarf plants. (L) Sixteen-day-old act7-4 mutant plant and a dwarf mutant plant expressing ACT1. (M) Protein gel blot analysis of a transgenic act7-4 mutant plant expressing ACT1. Note the absence of ACT1 in act7-4 mutant. The bottom blot shows equal amount of PEPC in both samples. (N) Four-day-old act2-1 mutant and normal act2-1 transgenic seedlings expressing low levels of ACT1. Note the complementation of stunted root hair phenotype in the transgenic seedling (n). (O) Six-day-old dwarf act2-1 mutant seedling expressing high levels of ACT1. (P) A 4-d-old act7-4 mutant and a normal act7-4 transgenic seedling expressing ACT1. Note the complementation of retarded root growth phenotype in the transgenic seedling (act7-4/A2P:A1).
Figure 3.
Figure 3.
Profilin and ADF-Mediated Suppression of the ACT1-Induced Dwarf Phenotype. Note that the coexpression of reproductive and vegetative profilin or ADF isovariants with ACT1 differentially reduce the percentage of dwarf plants. The results represent at least two different vacuum infiltration experiments. More than 100 independent transgenic lines were observed for each ACT and ACT + PRF constructs, and 75 lines were examined for each ACT + ADF construct. The bars represent sd.
Figure 4.
Figure 4.
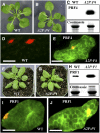
Effect of Profilin Ectopic Expression and Overexpression on Plant Growth. (A) Three-week-old wild-type seedling. (B) Three-week-old transgenic seedling misexpressing PRF4. (C) Protein gel blot (top panel) showing expression of PRF4 in transgenic (A2P:P4) but not wild-type leaf sample. Top blot reacted with MAbPRF45. The bottom panel shows a Coomassie blue–stained duplicate gel. (D) Wild-type leaf cell labeled with MAbPRF45 showing no staining. Nuclei stained with 4′,6-diamidino-2-phenylindole (DAPI) are shown in red. (E) Transgenic (A2P:P4) leaf cell showing strong staining for PRF4. Orange color indicates nucleus. (F) Twenty-five-day-old wild-type plant. (G) Twenty-five-day-old transgenic plant overexpressing PRF1 (A2P:P1). (H) Protein gel blot (top panel) showing strong expression of PRF1 in transgenic (A2P:P1) plant. Wild-type leaf sample shows a 14-kD faint band. Top blot reacted with PRF1-specific MAbPRF1. The bottom panel shows a Coomassie blue–stained duplicate gel. (I) Wild-type leaf cell labeled with MAbPRF1 showing a weak staining. Nucleus stained with DAPI is shown in red. (J) Transgenic (A2P:P1) leaf cell showing a strong staining for PRF1. Orange color indicates nucleus. Bars = 20 μm.
Figure 5.
Figure 5.
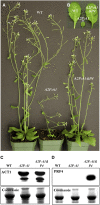
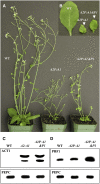
Suppression of ACT1-Induced Dwarf Phenotype by Coexpression of Pollen-Specific PRF4. (A) Approximately 7-week-old plants. A2P:A1, dwarf single transformant misexpressing ACT1; A2P:A1&P4, a double transformant misexpressing both ACT1 and PRF4 simultaneously. Note the suppression of dwarf phenotype in the double transgenic plant. (B) Rosette leaves of just-bolted wild-type and single (A2P:A1) and double (A2P:A1&P4) transgenic plants. (C) Protein gel blot analysis of ACT1 expression. Top panel shows a blot probed with MAb45a for ACT1. Both the dwarf single transformant misexpressing ACT1 and the normal double transgenic plant coexpressing ACT1 and PRF4 have same levels of ACT1 protein. The wild type has no detectable ACT1. Bottom panel shows a Coomassie blue–stained duplicate gel. (D) Protein gel blot analysis of PRF4 expression. Top panel shows a blot probed with MAbPRF45 for PRF4 protein. Only the double transgenic plant shows strong PRF4 band. Bottom panel is a Coomassie blue–stained duplicate gel to show equal loading of total protein.
Figure 6.
Figure 6.
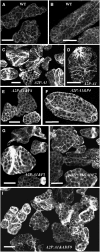
Immunofluorescence Labeling of Actin in Leaf Cells. (A) and (B) The wild type. (C) and (D) Dwarf plant cells misexpressing ACT1. (E) and (F) Cells from a suppressed, normal double transgenic plant coexpressing ACT1 and PRF4. (G) Cells from a dwarf double transgenic plant coexpressing ACT1 and PRF1. (H) Cells from a normal double transgenic plant coexpressing ACT1 and ADF7. (I) Cells from a dwarf double transgenic plant coexpressing ACT1 and ADF9. All samples were labeled with MAbGPa. Bars = 20 μm.
Figure 7.
Figure 7.
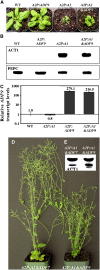
Lack of Suppression of the Dwarf Phenotype by Coexpression of Constitutive PRF1 with Reproductive ACT1. (A) Approximately 7-week-old plants. A2P:A1, dwarf single transformant misexpressing ACT1; A2P:A1&P1, a double transformant misexpressing ACT1 and overexpressing PRF1 simultaneously. Note the double transgenic plant still exhibiting dwarf phenotype. (B) Rosette leaves (the largest) of wild-type and single (A2P:A1) and double (A2P:A1&P1) transformants. (C) Protein gel blot analysis of ACT1 expression. Top panel shows a blot probed with MAb45a for ACT1. Bottom panel shows a strip of the same blot probed for PEPC. (D) Protein gel blot analysis of PRF1 expression. Top panel shows a blot probed with MAbPRF1 for PRF1 protein. Bottom panel shows a strip of the same blot probed for PEPC.
Figure 8.
Figure 8.
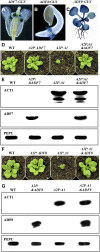
Suppression of ACT1-Induced Dwarf Phenotype by Coexpression of Pollen/Trichoblast-Specific ADFs. (A) to (C) ADF promoter-β-glucuronidase fusion gene expression. (A) Flower showing pollen-specific expression of ADF7. (B) Two-day-old germinating seedling showing root hair–specific expression of ADF8. (C) Two-week-old seedling showing constitutive expression of ADF9. (D) Twenty-four-day-old wild-type plant, single transformants misexpressing ADF7 (A2P:ADF7) and ACT1 (A2P:A1), and a double transformant (A2P:A1&ADF7) coexpressing ACT1 and ADF7. (E) Protein gel blot analysis of ACT1 and ADF7 expression in leaves. Top blot probed with reproductive actin-specific antibody MAb45a to show ACT1 protein. The weak bottom bands represent breakdown products. Middle blot from a duplicate gel is probed with MAbADF8, which recognizes ADF7. Bottom blot is probed with anti-PEPC antibody to show equal loading of proteins. Note the wild-type sample has no ACT1 and ADF7 proteins, the ADF7-misexpressing normal plant has no ACT1 protein, and the ACT1-misexpressing dwarf plant has no ADF7 protein. (F) Twenty-four-day-old wild-type plant, single transformants misexpressing ADF8 (A2P:ADF8) and ACT1 (A2P:A1), and a double transformant (A2P:A1&ADF8) coexpressing ACT1 and ADF8. (G) Protein gel blot analysis of ACT1 and ADF8 expression in leaf samples. Top blot probed with MAb45a to show ACT1 protein. The breakdown products were not detectable in this blot. Middle blot from a duplicate gel is probed with MAbADF8 to show ADF8 protein. Bottom panel probed with anti-PEPC antibody.
Figure 9.
Figure 9.
Effect of Coexpression of Reproductive ACT1 and Constitutive ADF9 on Plant Development. (A) Twenty-five-day-old wild-type plant, single transformants overexpressing ADF9 (A2P:ADF9) and misexpressing ACT1 (A2P:A1), and a double transformant (A2P:A1&ADF9) coexpressing ACT1 and ADF9. Note the dwarf stature of the double transformant. (B) Protein gel blot analysis of ACT1 in leaf samples. Top blot probed with MAb45a to show ACT1 protein. Bottom panel probed with anti-PEPC antibody. Wild-type and the normal single transformant overexpressing ADF9 contain no ACT1 protein. (C) RT-PCR analysis of ADF9 expression. The single A2P:ADF9 transformants and the double A2P:A1&ADF9 transgenic plants have >100 times the level of ADF9 transcripts than the wild type and plants misexpressing ACT1. Because of lack of ADF9-specific antibody, the levels of ADF9 expression are monitored here by RT-PCR analysis. (D) Adult double transgenic plants coexpressing ACT1 and ADF7 (left) and ACT1 and ADF9 (right). (E) Protein gel blot showing the levels of ACT1 protein in the double transgenic plants shown in (D). Probed with reproductive actin-specific MAb45a.

Similar articles

Cited by

References

    1. Allwood, E.G., Anthony, R.G., Smertenko, A.P., Reichelt, S., Drobak, B.K., Doonan, J.H., Weeds, A.G., and Hussey, P.J. (2002). Regulation of the pollen-specific actin-depolymerizing factor LlADF1. Plant Cell 14 2915–2927. - PMC - PubMed
    1. An, Y.Q., McDowell, J.M., Huang, S., McKinney, E.C., Chambliss, S., and Meagher, R.B. (1996). Strong, constitutive expression of the Arabidopsis ACT2/ACT8 actin subclass in vegetative tissues. Plant J. 10 107–121. - PubMed
    1. Bamburg, J.R. (1999). Proteins of the ADF/cofilin family: Essential regulators of actin dynamics. Annu. Rev. Cell Dev. Biol. 15 185–230. - PubMed
    1. Carlier, M.F. (1998). Control of actin dynamics. Curr. Opin. Cell Biol. 10 45–51. - PubMed
    1. Carlsson, L., Nyström, L.-E., Sundkvist, I., Markey, F., and Lindberg, U. (1977). Actin polymerizability is influenced by profilin, a low molecular weight protein in non-muscle cells. J. Mol. Biol. 115 465–483. - PubMed

Publication types

MeSH terms