

Comparison of kidney injury molecule-1 and other nephrotoxicity biomarkers in urine and kidney following acute exposure to gentamicin, mercury, and chromium
- PMID: 17934191
- PMCID: PMC2744478
- DOI: 10.1093/toxsci/kfm260
Comparison of kidney injury molecule-1 and other nephrotoxicity biomarkers in urine and kidney following acute exposure to gentamicin, mercury, and chromium
Abstract
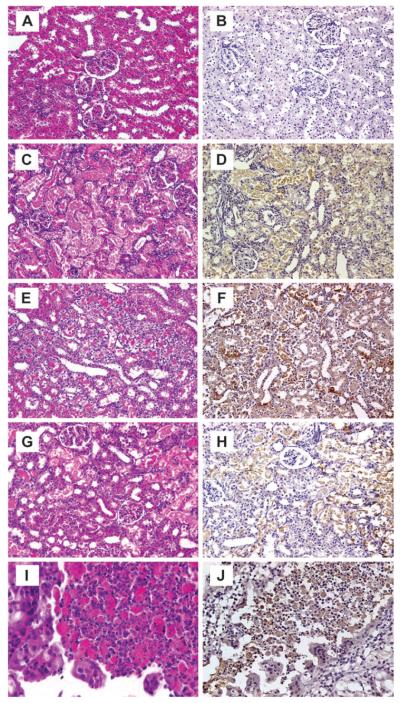
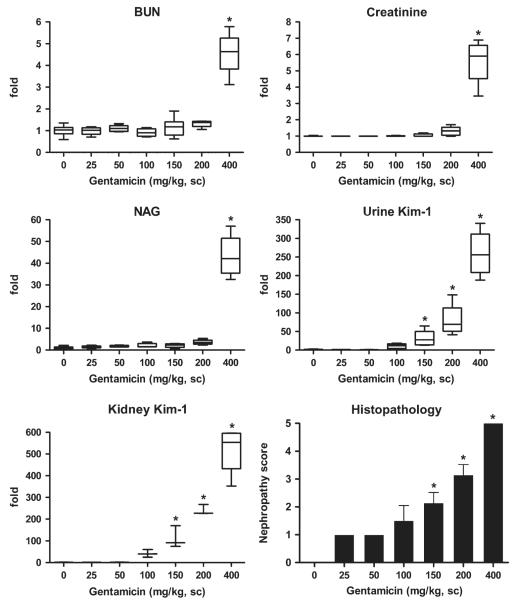
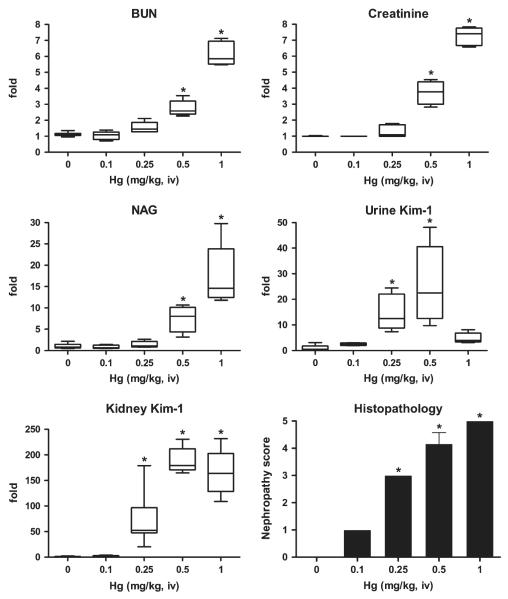
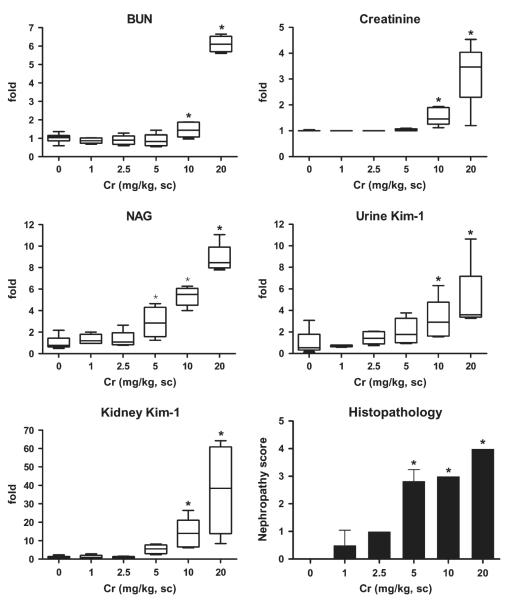
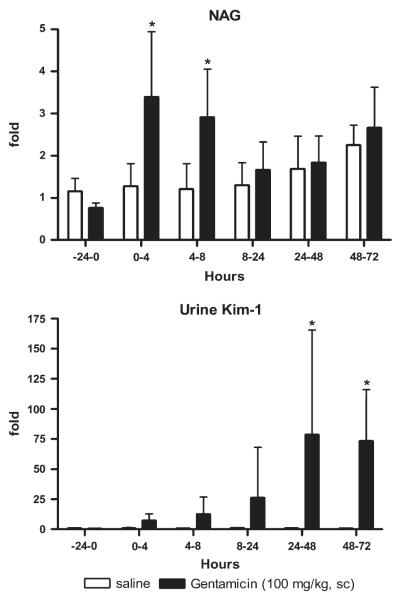
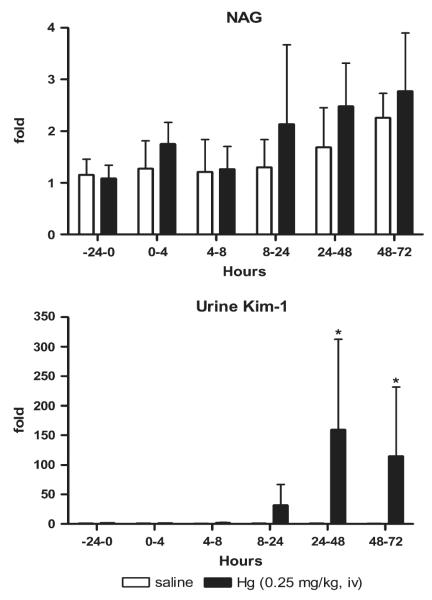
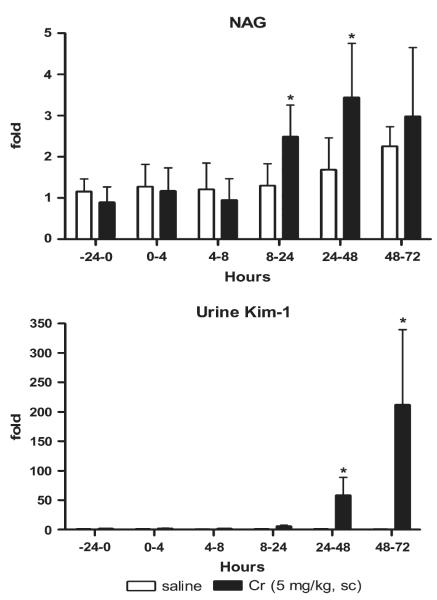
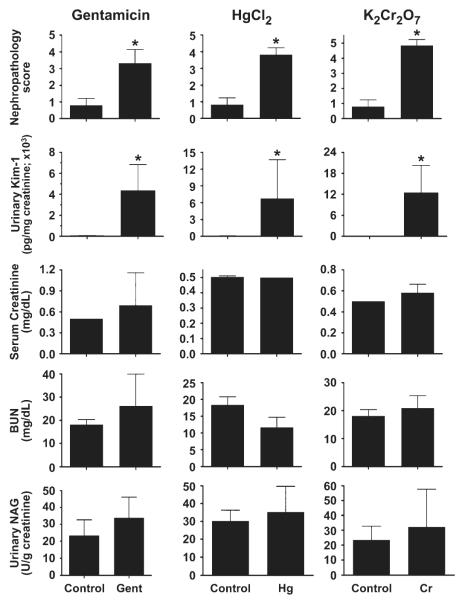
Sensitive biomarkers are needed to detect kidney injury at the earliest stages. The objective of this study was to determine whether the appearance of kidney injury molecule-1 (Kim-1) protein ectodomain in urine and kidney injury molecule-1/hepatitis A viral cellular receptor-1 (Kim-1/Havcr1) gene expression in kidney tissue may be more predictive of renal injury after exposure to nephrotoxicants when compared to traditionally used biomarkers. Male Sprague-Dawley rats were injected with a range of doses of gentamicin, mercury (Hg; HgCl2), or chromium (Cr; K2Cr2O7). The results showed that increases in urinary Kim-1 and kidney Kim-1/Havcr1 gene expression paralleled the degree of severity of renal histopathology and were detected at lower doses of nephrotoxicants when compared to blood urea nitrogen (BUN), serum creatinine, and urinary N-acetyl-beta-D-glucosaminidase (NAG). In a time course study, urinary Kim-1 was elevated within 24 h after exposure to gentamicin (100 mg/kg), Hg (0.25 mg/kg), or Cr (5 mg/kg) and remained elevated through 72 h. NAG responses were nephrotoxicant dependent with elevations occurring early (gentamicin), late (Cr), or no change (Hg). At 72 h, after treatment with any of the three nephrotoxicants, there was increased Kim-1 immunoreactivity and necrosis involving approximately 50% of the proximal tubules; however, only urinary Kim-1 was significantly increased, while BUN, serum creatinine, and NAG were not different from controls. In rats treated with the hepatotoxicant galactosamine (1.1 mg/kg), serum alanine aminotransferase was increased, but no increase in urinary Kim-1 was observed. Urinary Kim-1 and kidney Kim-1/Havcr1 expression appear to be sensitive and tissue-specific biomarkers that will improve detection of early acute kidney injury following exposure to nephrotoxic chemicals and drugs.
Figures
Similar articles
-
Kidney injury molecule-1: a tissue and urinary biomarker for nephrotoxicant-induced renal injury.Am J Physiol Renal Physiol. 2004 Mar;286(3):F552-63. doi: 10.1152/ajprenal.00285.2002. Epub 2003 Nov 4. Am J Physiol Renal Physiol. 2004. PMID: 14600030
-
Urinary kidney injury molecule-1: a sensitive quantitative biomarker for early detection of kidney tubular injury.Am J Physiol Renal Physiol. 2006 Feb;290(2):F517-29. doi: 10.1152/ajprenal.00291.2005. Epub 2005 Sep 20. Am J Physiol Renal Physiol. 2006. PMID: 16174863
-
Immunolocalization of Kim-1, RPA-1, and RPA-2 in kidney of gentamicin-, mercury-, or chromium-treated rats: relationship to renal distributions of iNOS and nitrotyrosine.Toxicol Pathol. 2008 Apr;36(3):397-409. doi: 10.1177/0192623308315832. Epub 2008 Apr 25. Toxicol Pathol. 2008. PMID: 18441258 Free PMC article.
-
Urinary vanin-1 as a novel biomarker for early detection of drug-induced acute kidney injury.J Pharmacol Exp Ther. 2012 Jun;341(3):656-62. doi: 10.1124/jpet.112.192807. Epub 2012 Mar 7. J Pharmacol Exp Ther. 2012. PMID: 22399813
-
Earlier recognition of nephrotoxicity using novel biomarkers of acute kidney injury.Clin Toxicol (Phila). 2011 Oct;49(8):720-8. doi: 10.3109/15563650.2011.615319. Clin Toxicol (Phila). 2011. PMID: 21970770 Review.
Cited by
-
Effects of combination of aliskiren and pentoxyfylline on renal function in the rat remnant kidney model of chronic renal failure.Indian J Pharmacol. 2015 Jan-Feb;47(1):80-5. doi: 10.4103/0253-7613.150351. Indian J Pharmacol. 2015. PMID: 25821316 Free PMC article.
-
Thymoquinone Induces Nrf2 Mediated Adaptive Homeostasis: Implication for Mercuric Chloride-Induced Nephrotoxicity.ACS Omega. 2022 Feb 18;7(8):7370-7379. doi: 10.1021/acsomega.2c00028. eCollection 2022 Mar 1. ACS Omega. 2022. PMID: 35252727 Free PMC article.
-
Protective Effects of the Segmental Renal Artery Clamping Technique on Ischemia-Reperfusion Injury in db/db Diabetic Mice.Biomed Res Int. 2017;2017:4763828. doi: 10.1155/2017/4763828. Epub 2017 Feb 12. Biomed Res Int. 2017. PMID: 28299325 Free PMC article.
-
Emerging urinary biomarkers in the diagnosis of acute kidney injury.Expert Opin Med Diagn. 2008 Apr;2(4):387-398. doi: 10.1517/17530059.2.4.387. Expert Opin Med Diagn. 2008. PMID: 19079800 Free PMC article.
-
Pharmacokinetic profile that reduces nephrotoxicity of gentamicin in a perfused kidney-on-a-chip.Biofabrication. 2016 Mar 24;8(1):015021. doi: 10.1088/1758-5090/8/1/015021. Biofabrication. 2016. PMID: 27011358 Free PMC article.
References
-
- Addya S, Chakravarti K, Basu A, Santra M, Haldar S, Chatterjee GC. Effects of mercuric chloride on several scavenging enzymes in rat kidney and influence of vitamin E supplementation. Acta Vitaminol. Enzymol. 1984;101(1):159–170. - PubMed
-
- Ali BH. Gentamicin nephrotoxicity in humans and animals: Some recent research. Gen. Pharmacol. 1995;26(7):1477–1487. - PubMed
-
- Bailly V, Zhang Z, Meier W, Cate R, Sanicola M, Bonventre JV. Shedding of kidney injury molecule-1, a putative adhesion protein involved in renal regeneration. J. Biol. Chem. 2002;277(42):39739–39748. - PubMed
-
- Barrera D, Maldonado PD, Medina-Campos ON, Hernandez-Pando R, Ibarra-Rubio ME, Pedraza-Chaverri J. HO-1 induction attenuates renal damage and oxidative stress induced by K2Cr2O7. Free. Radic. Biol. Med. 2003;34(11):1390–1398. - PubMed
-
- Biber TU, Mylle M, Baines AD, Gottschalk CW, Oliver JR, MacDowell MC. A study by micropuncture and microdissection of acute renal damage in rats. Am. J. Med. 1968;44(5):664–705. - PubMed
Publication types
MeSH terms
Substances
Grants and funding
LinkOut - more resources
Full Text Sources
Other Literature Sources
Medical
