

Phosphopeptide elution times in reversed-phase liquid chromatography
- PMID: 17935722
- PMCID: PMC2096734
- DOI: 10.1016/j.chroma.2007.09.032
Phosphopeptide elution times in reversed-phase liquid chromatography
Abstract
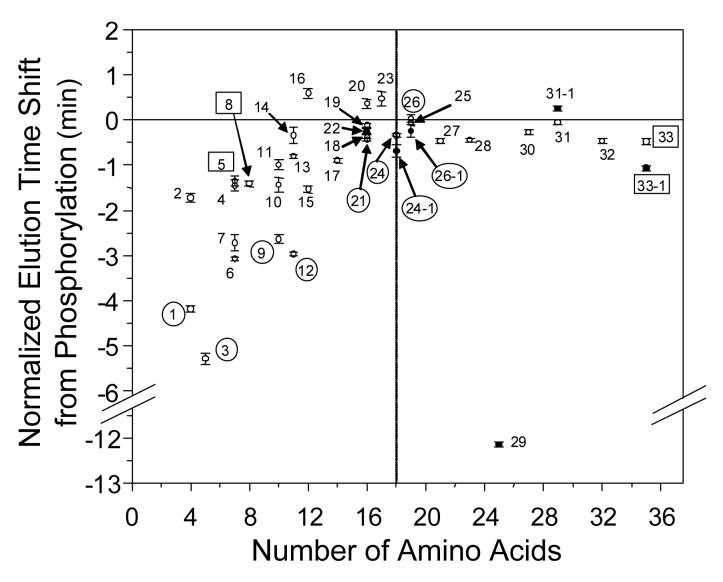
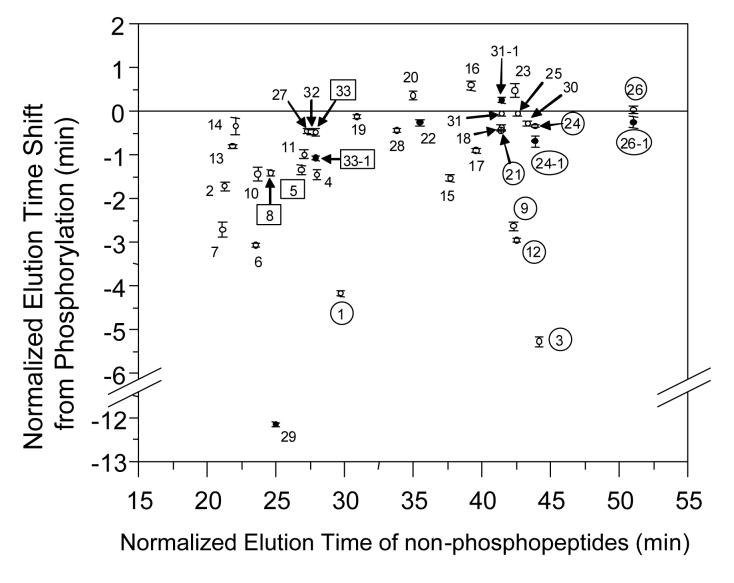
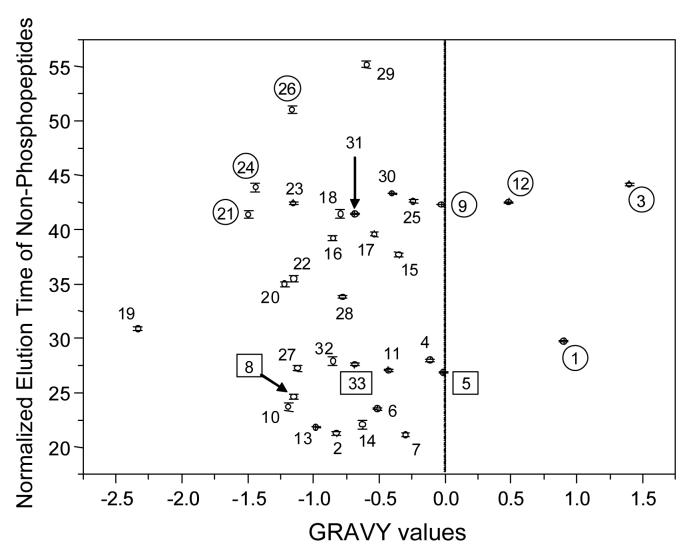
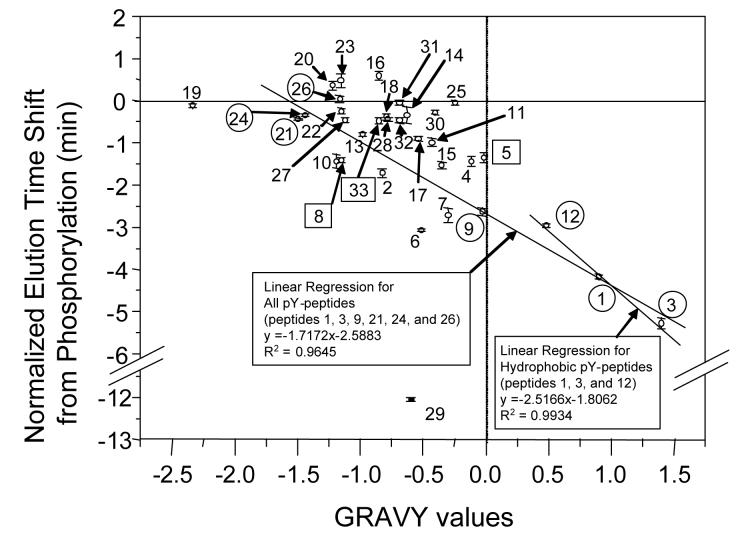
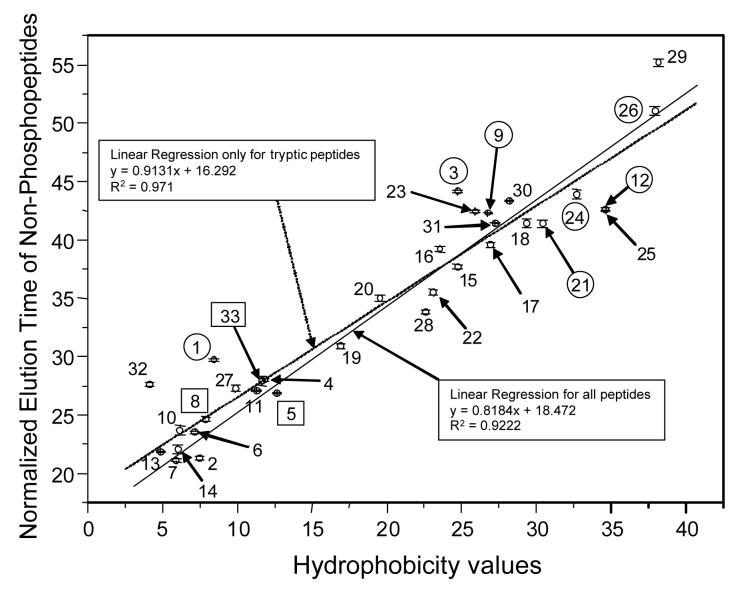
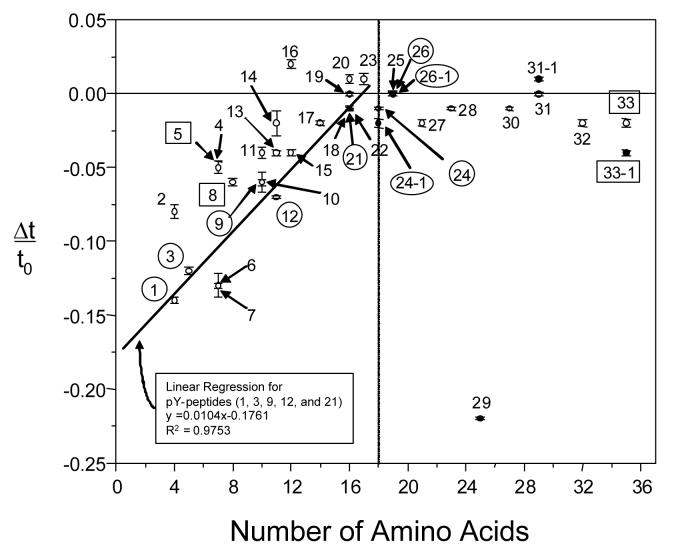
Elution time shifts between 33 different peptides and their corresponding phosphopeptides ranging from 4 amino acid residues to 35 amino acids in length were systematically investigated using high-resolution reversed-phase liquid chromatography (RPLC)-tandem mass spectrometry (MS/MS) analysis with trifluoroacetic acid as the ion pairing agent. Observed peptide elution time shifts for a single phosphorylation ranged from -5.28 min (for pYVPML) to +0.59 min (for HRDpSGLLDSLGR). Peptides containing a phosphotyrosine residue displayed a significant decrease in elution time following phosphorylation compared to their similar-sized peptides with phosphoserine or phosphothreonine residues. While peptide phosphorylation generally led to a decrease in the observed elution time, five peptides displayed increased elution times as a result of phosphorylation. For large peptides (> or =18 amino acids), the elution time shifts due to single phosphorylation were limited (ranging between -0.48 and +0.03 min), while the elution time shifts for small peptides (<18 amino acids) were characterized by a larger deviation (ranging between -5.28 and +0.59 min). The predictive capability for the observed RPLC elution time change due to phosphorylation has been suggested, which will aid in assigning confident phosphopeptide identifications and their subsequent confirmation.
Figures
Similar articles
-
Phosphopeptide detection and sequencing by matrix-assisted laser desorption/ionization quadrupole time-of-flight tandem mass spectrometry.J Mass Spectrom. 2002 Feb;37(2):179-90. doi: 10.1002/jms.271. J Mass Spectrom. 2002. PMID: 11857762
-
Fragmentation of phosphopeptides in an ion trap mass spectrometer.J Am Soc Mass Spectrom. 1998 Nov;9(11):1175-88. doi: 10.1016/S1044-0305(98)00088-9. J Am Soc Mass Spectrom. 1998. PMID: 9794085
-
Reference-facilitated phosphoproteomics: fast and reliable phosphopeptide validation by microLC-ESI-Q-TOF MS/MS.Mol Cell Proteomics. 2007 Aug;6(8):1380-91. doi: 10.1074/mcp.M600480-MCP200. Epub 2007 May 17. Mol Cell Proteomics. 2007. PMID: 17510049
-
The effect of the mobile phase additives on sensitivity in the analysis of peptides and proteins by high-performance liquid chromatography-electrospray mass spectrometry.J Chromatogr B Analyt Technol Biomed Life Sci. 2005 Oct 25;825(2):111-23. doi: 10.1016/j.jchromb.2005.03.041. Epub 2005 Apr 26. J Chromatogr B Analyt Technol Biomed Life Sci. 2005. PMID: 16213445 Review.
-
Protein posttranslational modifications: phosphorylation site analysis using mass spectrometry.Methods Biochem Anal. 2005;45:85-106. Methods Biochem Anal. 2005. PMID: 19235292 Review. No abstract available.
Cited by
-
Comparative analysis of Erk phosphorylation suggests a mixed strategy for measuring phospho-form distributions.Mol Syst Biol. 2011 Apr 12;7:482. doi: 10.1038/msb.2011.15. Mol Syst Biol. 2011. PMID: 21487401 Free PMC article.
-
Effect of Phosphorylation on the Collision Cross Sections of Peptide Ions in Ion Mobility Spectrometry.Mass Spectrom (Tokyo). 2021;10:A0093. doi: 10.5702/massspectrometry.A0093. Epub 2021 Jan 30. Mass Spectrom (Tokyo). 2021. PMID: 33552826 Free PMC article.
-
Determination of phosphorylation sites in the DivIVA cytoskeletal protein of Streptomyces coelicolor by targeted LC-MS/MS.J Proteome Res. 2013 Sep 6;12(9):4187-92. doi: 10.1021/pr400524d. Epub 2013 Aug 15. J Proteome Res. 2013. PMID: 23905541 Free PMC article.
-
Deep Intact Proteoform Characterization in Human Cell Lysate Using High-pH and Low-pH Reversed-Phase Liquid Chromatography.J Am Soc Mass Spectrom. 2019 Dec;30(12):2502-2513. doi: 10.1007/s13361-019-02315-2. Epub 2019 Nov 21. J Am Soc Mass Spectrom. 2019. PMID: 31755044 Free PMC article.
-
The Dynamic and Crucial Role of the Arginine Methylproteome in Myoblast Cell Differentiation.Int J Mol Sci. 2023 Jan 20;24(3):2124. doi: 10.3390/ijms24032124. Int J Mol Sci. 2023. PMID: 36768448 Free PMC article.
References
Publication types
MeSH terms
Substances
Grants and funding
LinkOut - more resources
Full Text Sources
