. 2007 Nov 23;149(4):943-61.
doi: 10.1016/j.neuroscience.2007.07.067. Epub 2007 Sep 12.

A chronic histopathological and electrophysiological analysis of a rodent hypoxic-ischemic brain injury model and its use as a model of epilepsy

Affiliations

A chronic histopathological and electrophysiological analysis of a rodent hypoxic-ischemic brain injury model and its use as a model of epilepsy

P A Williams et al. Neuroscience. .

Abstract

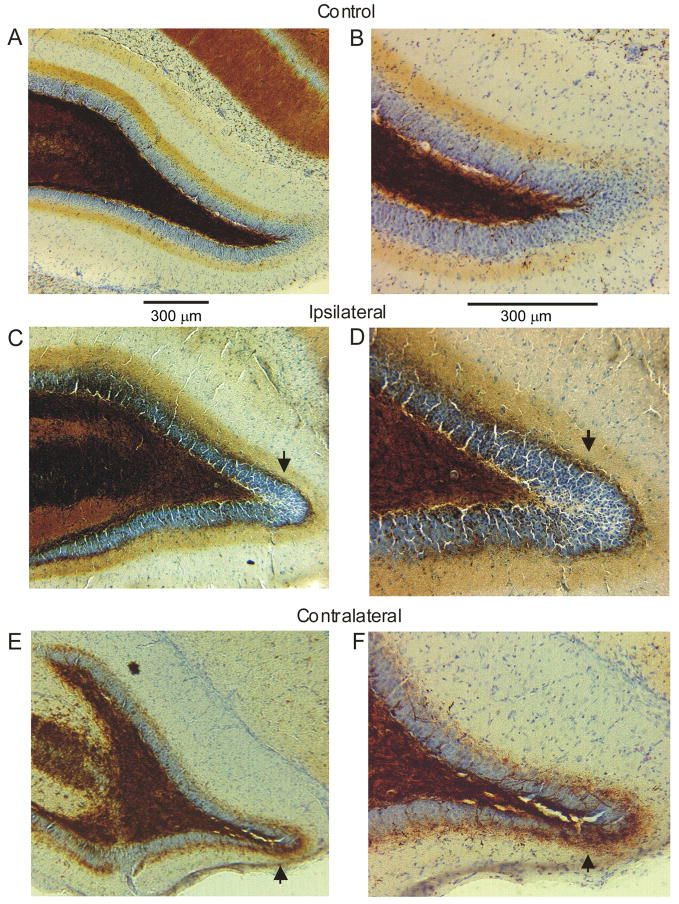
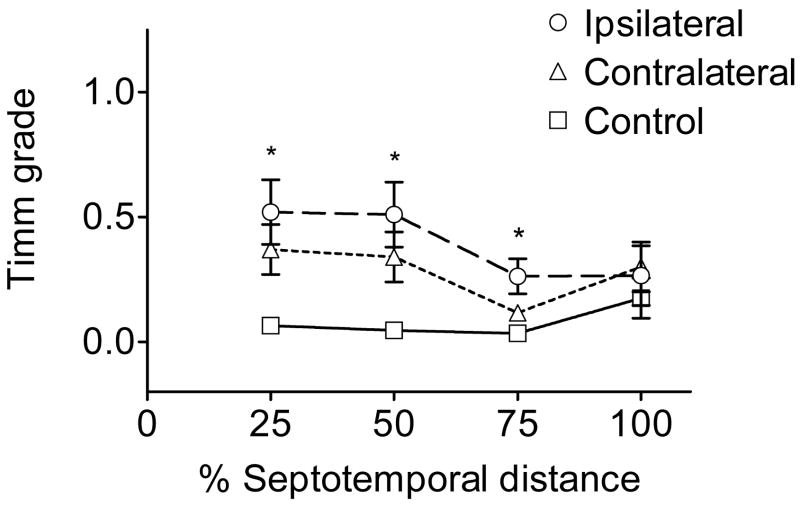
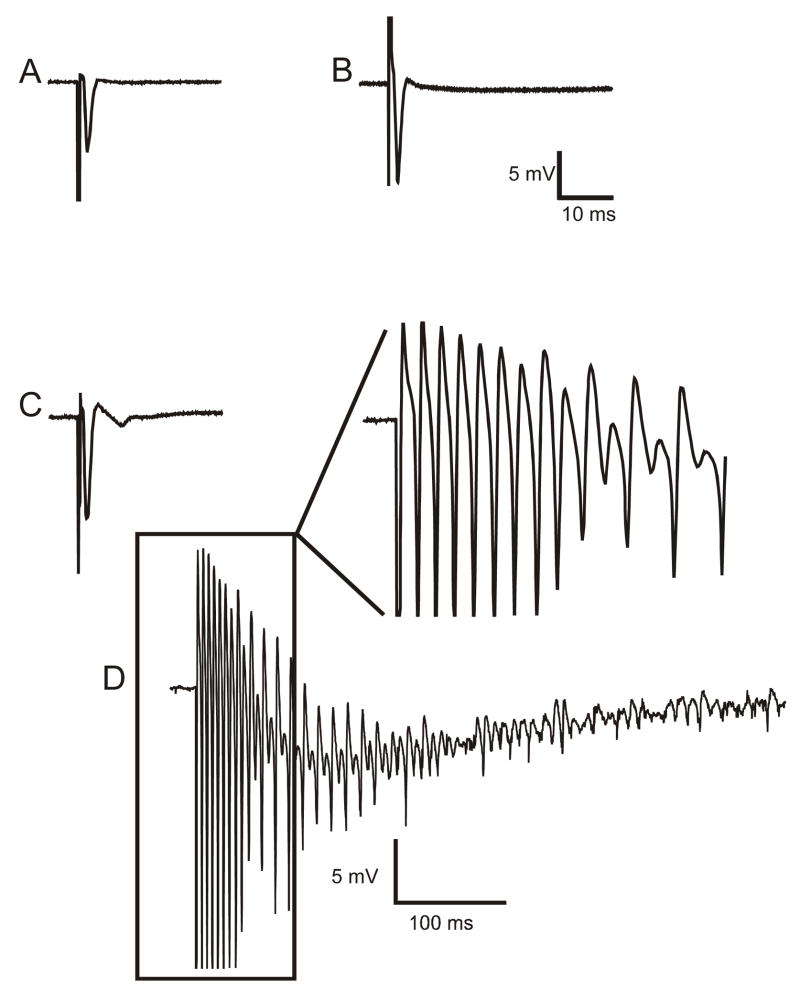
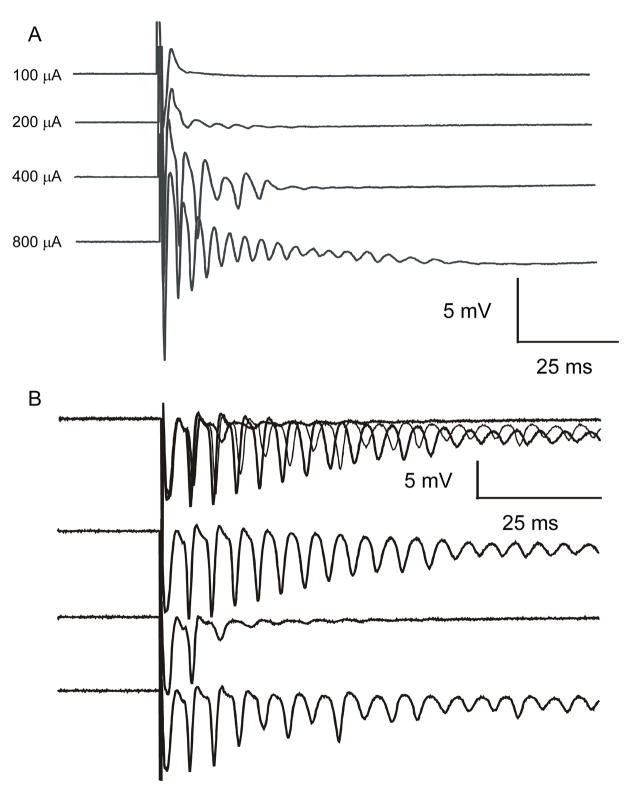
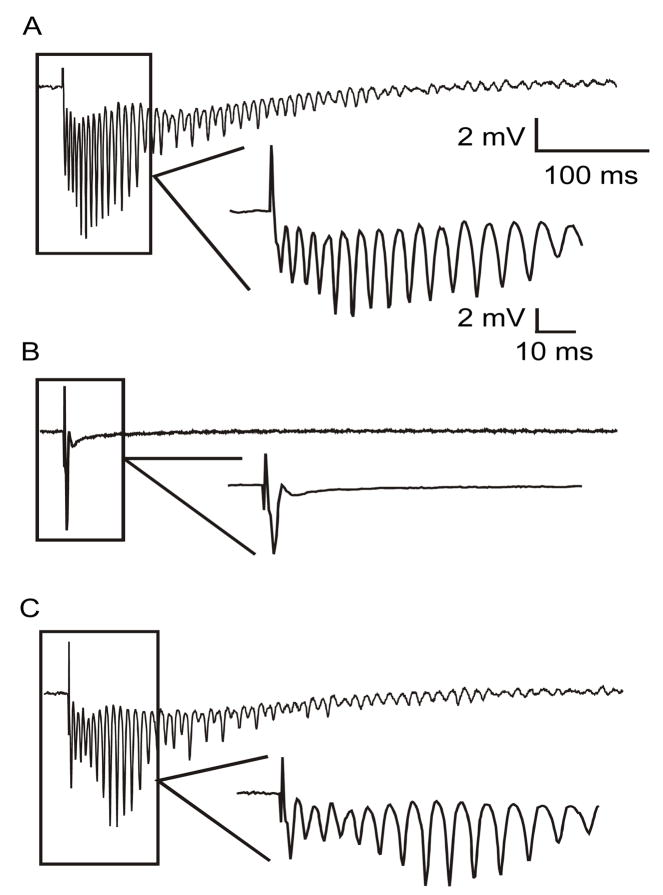
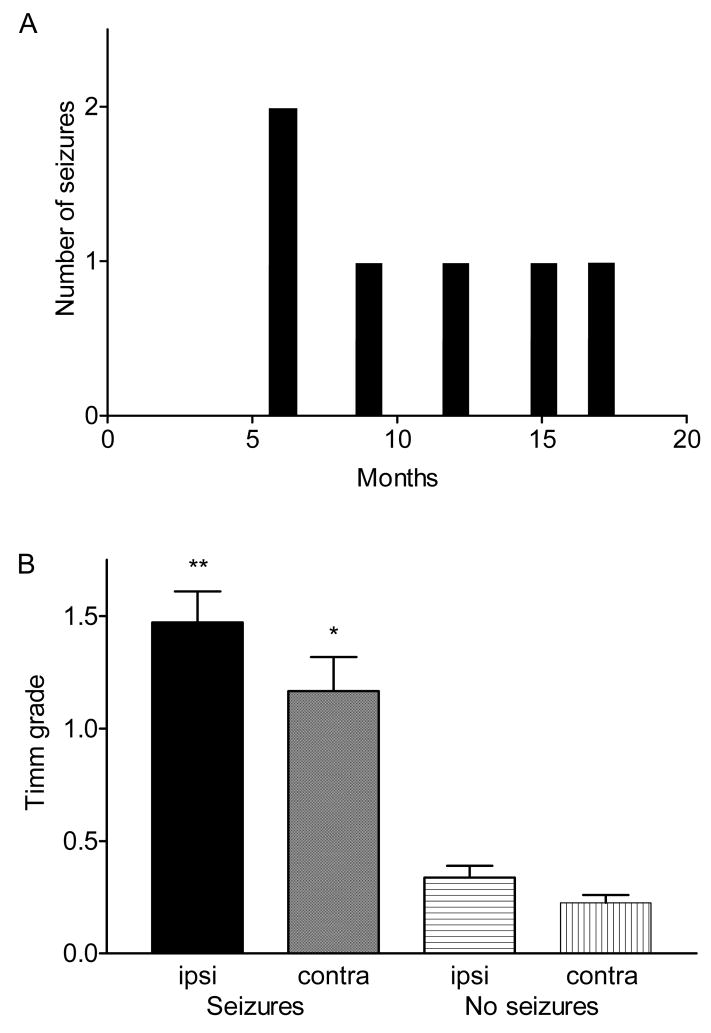
Ischemic brain injury is one of the leading causes of epilepsy in the elderly, and there are currently no adult rodent models of global ischemia, unilateral hemispheric ischemia, or focal ischemia that report the occurrence of spontaneous motor seizures following ischemic brain injury. The rodent hypoxic-ischemic (H-I) model of brain injury in adult rats is a model of unilateral hemispheric ischemic injury. Recent studies have shown that an H-I injury in perinatal rats causes hippocampal mossy fiber sprouting and epilepsy. These experiments aimed to test the hypothesis that a unilateral H-I injury leading to severe neuronal loss in young-adult rats also causes mossy fiber sprouting and spontaneous motor seizures many months after the injury, and that the mossy fiber sprouting induced by the H-I injury forms new functional recurrent excitatory synapses. The right common carotid artery of 30-day old rats was permanently ligated, and the rats were placed into a chamber with 8% oxygen for 30 min. A quantitative stereologic analysis revealed that the ipsilateral hippocampus had significant hilar and CA1 pyramidal neuronal loss compared with the contralateral and sham-control hippocampi. The septal region from the ipsilateral and contralateral hippocampus had small but significantly increased amounts of Timm staining in the inner molecular layer compared with the sham-control hippocampi. Three of 20 lesioned animals (15%) were observed to have at least one spontaneous motor seizure 6-12 months after treatment. Approximately 50% of the ipsilateral and contralateral hippocampal slices displayed abnormal electrophysiological responses in the dentate gyrus, manifest as all-or-none bursts to hilar stimulation. This study suggests that H-I injury is associated with synaptic reorganization in the lesioned region of the hippocampus, and that new recurrent excitatory circuits can predispose the hippocampus to abnormal electrophysiological activity and spontaneous motor seizures.


Figures

Figure 1
Figure 1
Hippocampal neuron loss after H-I injury in the septal hippocampus. Low- and high-magnification micrographs (left and right respectively) of cresyl-violet stained sections are shown from a sham control rat (A, B), the ipsilateral hippocampus from an H-I rat (C, D), and the contralateral hippocampus from the same H-I animal (E, F). The hilus and CA1 of the ipsilateral hippocampus appeared most susceptible to H-I injury (panels C and D). Both the sham control and contralateral hippocampi did not show obvious neuron loss (panels A, B and E, F respectively).
Figure 2
Figure 2
Quantitative analysis of neuron loss along the septotemporal axis of the hippocampus after H-I injury. The ipsilateral hippocampus had significant neuron loss in the hilus (Panel A) throughout the septotemporal axis compared to both the sham control and the contralateral hippocampus (p<0.01. ANOVA, SNK, asterisks denote significant differences), except at the temporal end (100%), where the ipsilateral hippocampus was significantly different from the sham control (p<0.05, ANOVA, SNK), but not the contralateral hippocampus (p>0.05, ANOVA, SNK). The contralateral hippocampus did not have significant neuron loss compared to the sham control hippocampus (p>0.05, ANOVA, SNK). Total mean hilar neuronal counts were 11,120 ± 2,713 for the ipsilateral hippocampi; 22,224 ± 1,350 for the contralateral hippocampi, and 25,186 ± 1,608 for control hippocampi with a 56% reduction in hilar neurons in ipsilateral hippocampi. The total mean counts for hilar neurons from ipsilateral hippocampi were significantly different from both contralateral and control hippocampi (p<0.001, ANOVA, SNK), while the total mean hilar counts for contralateral hippocampi were not signifantly different from controls (p>0.05, ANOVA, SNK). Severe pyramidal cell loss was apparent in the ipsilateral CA1 area of the septal hippocampus (25% and 50%), and neuron counts were significantly different (p<0.001, ANOVA, SNK, Panel B, asterisks denote significant differences) from both the sham control and contralateral hippocampus up to the temporal end (100%), where neuron counts in the ipsilateral hippocampus were not significantly different from either the sham control or the contralateral hippocampus (p>0.05, ANOVA, SNK). Total mean CA1 neuronal counts were 27,729 ± 8,539 for the ipsilateral hippocampi; 87,317 ± 7,773 for the contralateral hippocampi, and 91,218 ± 5,630 for control hippocampi with a 70% reduction in CA1 neurons in ipsilateral hippocampi. The total mean counts for CA1 neurons from ipsilateral hippocampi were significantly different from both contralateral and control hippocampi (p<0.001, ANOVA, SNK), while the total mean CA1 counts for contralateral hippocampi were not signifantly different from controls (p>0.05, ANOVA, SNK). Neuron counts in the hilus (Panel C) of the ipsilateral hippocampus were significantly correlated to CA1 neuron counts in the ipsilateral hippocampus (r2=0.71, p=0.0001), suggesting that neuron loss in one area was associated with neuron loss in the other area.
Figure 3
Figure 3
Timm stain in the IML was assessed in both the ipsilateral and contralateral hippocampi of the H-I lesioned rats. No Timm stain was seen in the IML of the control hippocampi (A, B). Both the ipsilateral (C, D) and contralateral (E, F) hippocampi from H-I lesioned rats contained small-to-modest amounts of Timm stain in the IML (these would be scored as “2” and “1,” respectively, with the scale of Tauck and Nadler(1985)). Arrows point to abnormal Timm stain in the IML.
Figure 4
Figure 4
Septotemporal analysis of Timm stain in the IML. The 25% region was defined as the septal end, the 100% region was defined as the temporal end, and each data point is an average Timm score. Timm stain in the IML of the ipsilateral hippocampi from lesioned animals was not robust, but significantly elevated in the septal and middle hippocampus (i.e., the 25%, 50% and 75% region of the hippocampus, marked by asterisks) as compared to the sham controls (p<0.05, Kruskal-Wallis; see Fig. 3A). A median score of 0.5 was obtained for all three regions of the ipsilateral hippocampus with a range of 0–2 for the Timm stain in the IML compared to a median score of 0 with a range of 0–0.5 for controls. The contralateral hippocampus had significantly elevated Timm stain in the IML compared to controls in the 25% and 50% hippocampal region (p<0.05, Kruskal-Wallis) with the same median and range as the ipsilateral hippocampus. Average scores are shown in the graph for ease of representation.
Figure 5
Figure 5
Extracellular responses of dentate granule cells to hilar stimulation in a septal hippocampal slice bathed in either control solution or in ACSF containing elevated [K+]o (6 mM) with 30 μM bicuculline. Panels A (slice from a control animal) and B (slice from the ipsilateral hippocampus of H-I treated animal) show antidromic responses from the granule cell layer to hilar stimulation in control solution. Panels C (control) and D (ipsilateral H-I) illustrate responses to hilar stimulation from the same recording site in ACSF containing 6 mM [K+]o and 30 μM bicuculline. The field-potential responses of slices from control rats to hilar stimulation in 6 mM [K+]o and 30 μM bicuculline showed either a single antidromic population spike, or occasionally, a small graded burst with a few population spikes (see Fig. 6). Several months after H-I treatment, hilar stimulation evoked a large burst of population spikes that occurred in the ipsilateral hippocampus, which was only seen in slices from the experimental group in 6 mM [K+]o and 30 μM bicuculline. All traces are averages of five responses, except for panel D, which shows a single trace. Stimulus artifacts have been reduced, and the initial population spike of the burst in panel D has been clipped.
Figure 6
Figure 6
Burst discharges recorded from the granule cell layer after hilar stimulation in slices from the ipsilateral hippocampus of a rat from the sham-surgery control group (A) and a rat from the experimental group several months after H-I treatment (B). All recordings were made in 6 mM [K+]o and 30 μM bicuculline with antidromic stimulation. Panel A illustrates a graded response to hilar stimulation in a slice from a sham control rat. The number of population spikes progressively increased as the stimulus intensity increased from 100 μA to 800 μA. In the ipsilateral hippocampal slices recorded from rats several months after H-I treatment, graded increases in stimulus intensity yielded all-or-none bursts (not graded bursts). Panel B shows superimposed responses to three stimuli at 400 μA and 0.2 Hz. The three lower traces are the individual responses shown in the upper trace. In the middle individual trace, note the failure of the slice to generate a long burst of population spikes. Prolonged bursts were seen prior to (upper individual trace) and following (lower individual trace) the burst failure.
Figure 7
Figure 7
Pharmacological evidence that glutamatergic synapses mediated the all-or-none network bursts recorded from the ipsilateral hippocampi of the H-I rats. Panel A shows a burst of population spikes to hilar stimulation in 6 mM [K+]o and 30 μM bicuculline. Panel B shows recordings from the same slice while bathed in the same solution above, with the addition of 50 μM AP-5 and 50 μM DNQX. Note the complete blockade of the burst of population spikes from panel A. Panel C shows the response from the same slice after 120 min of washout of the AP-5 and DNQX (i.e., back to 6 mM [K+]o and 30 μM bicuculline. The all-or-none burst returned with the washout of the glutamate antagonists.
Figure 8
Figure 8
Focal flash photolysis of caged glutamate was applied to the granule cell layer to test for local excitatory circuits in the dentate gyrus. Whole cell responses were recorded from granule cells; responses are shown to photostimulation in the nearby granule cell layer from a sham-surgical control rat (A) and from an H-I-treated rat (B). Both panels show whole-cell patch-clamp recordings at resting membrane potential (H-I-treated animal = −77 mV; control rat = −75 mV, corrected for the liquid junction potential). The granule cell from the HI-treated animal was located in the middle of the outer blade, and photostimulation was applied at the end of the outer blade at a distance of approximately 150 μm. The granule cell from the sham-surgical control was located in the apex, and the flash was applied approximately 300 μm away in the inner blade.
Figure 9
Figure 9
Observation of motor seizures as a function of time after H-I insult and in association with the presence of Timm stain in the IML. The rats with observed seizures (n=3) survived for 18 months after H-I. Panel A shows the occurrence of seizures at different months after the H-I injury for those rats that were seen to have seizures. Panel B shows that the animals with motor seizures had significantly more Timm stain in the IML of both the ipsilateral and contralateral hippocampi compared to the lesioned rats with no seizures (p<0.001, Kruskal-Wallis, the median Timm stain score was 1.5, with a range of 0.5–2.0 for the ipsilateral IML in rats with seizures; the median Timm stain score was 1, with a range of 0.5–2.0 for the contralateral IML in rats with seizures; the median Timm stain score was 0, with a range of 0–1.0 for the ipsilateral IML in rats without seizures; the median Timm stain score was 0, with a range of 0–0.5 for the contralateral IML in rats without seizures). Timm stain in the ipsilateral hippocampi from rats with seizures (double asterisk) was also significantly elevated (p<0.05, Kruskal-Wallis) as compared to the contralateral hippocampus from the same rats (single asterisk). Scores are shown as an average and SEM.

Similar articles

Cited by

References

    1. Amaral DG. A golgi study of cell types in the hilar region of the hippocampus in the rat. J Comp Neurol. 1978;182:851–914. - PubMed
    1. Arabadzisz D, Freund TF. Changes in excitatory and inhibitory circuits of the rat hippocampus 12–14 months after complete forebrain ischemia. Neuroscience. 1999;92:27–45. - PubMed
    1. Arabadzisz D, Ylinen A, Emri Z. Increased inter-spike intervals and fast after-hyperpolarization of action potentials in rat hippocampal pyramidal cells accompanied with altered calbindin immunoreactivity 10–12 months after global forebrain ischemia. Neurosci Lett. 2002;331:103–106. - PubMed
    1. Babb TL, Brown WJ. Pathological findings in epilepsy. In: Engel J, editor. Surgical Treatment of the Epilepsies. New York: Raven Press; 1987. pp. 511–540.
    1. Berges S, Moulin Berger E, Tatu L, Sablot D, Challier B, Rumbach L. Seizures and epilepsy following strokes: recurrence factors. Eur Neurol. 2000;43:3–8. - PubMed

Publication types

MeSH terms

Substances