Concurrent activation of the somatosensory forebrain and deactivation of periaqueductal gray associated with diabetes-induced neuropathic pain
- PMID: 17936273
- PMCID: PMC2180394
- DOI: 10.1016/j.expneurol.2007.09.001
Concurrent activation of the somatosensory forebrain and deactivation of periaqueductal gray associated with diabetes-induced neuropathic pain
Abstract
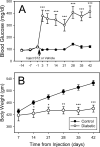
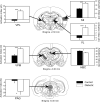
We combined behavioral testing with brain imaging using (99m)Tc-HMPAO (Amersham Health) to identify CNS structures reflecting alterations in pain perception in the streptozotocin (STZ) model of type I diabetes. We induced diabetic hyperglycemia (blood glucose >300 mg/dl) by injecting male Sprague-Dawley rats with STZ (45 mg/kg i.p.). Four weeks after STZ-diabetic rats exhibited behaviors indicative of neuropathic pain (hypersensitivity thermal stimuli) and this hypersensitivity persisted for up to 6 weeks. Imaging data in STZ-diabetic rats revealed significant increases in the activation of brain regions involved in pain processing after 6 weeks duration of diabetes. These regions included secondary somatosensory cortex, ventrobasal thalamic nuclei and the basolateral amygdala. In contrast, the activation in habenular nuclei and the midbrain periaqueductal gray were markedly decreased in STZ rats. These data suggest that pain in diabetic neuropathy may be due in part to hyperactivity in somatosensory structures coupled with a concurrent deactivation of structures mediating antinociception.
Figures


Similar articles
-
Contributions of purinergic P2X3 receptors within the midbrain periaqueductal gray to diabetes-induced neuropathic pain.J Physiol Sci. 2015 Jan;65(1):99-104. doi: 10.1007/s12576-014-0344-5. Epub 2014 Nov 1. J Physiol Sci. 2015. PMID: 25367719 Free PMC article.
-
Establishment of a rat model of type II diabetic neuropathic pain.Pain Med. 2014 Apr;15(4):637-46. doi: 10.1111/pme.12387_1. Pain Med. 2014. PMID: 24716590
-
Regional changes in forebrain activation during the early and late phase of formalin nociception: analysis using cerebral blood flow in the rat.Pain. 1998 Apr;75(2-3):355-65. doi: 10.1016/s0304-3959(98)00016-5. Pain. 1998. PMID: 9583772 Free PMC article.
-
Magnesium attenuates chronic hypersensitivity and spinal cord NMDA receptor phosphorylation in a rat model of diabetic neuropathic pain.J Physiol. 2010 Nov 1;588(Pt 21):4205-15. doi: 10.1113/jphysiol.2010.197004. J Physiol. 2010. PMID: 20837644 Free PMC article.
-
Oxcarbazepine antinociception in animals with inflammatory pain or painful diabetic neuropathy.Clin Exp Pharmacol Physiol. 2004 Jan-Feb;31(1-2):57-64. doi: 10.1111/j.1440-1681.2004.03950.x. Clin Exp Pharmacol Physiol. 2004. PMID: 14756685
Cited by
-
Habenula lesions improve glucose metabolism in rats with type 2 diabetes by increasing insulin sensitivity and inhibiting gluconeogenesis.BMJ Open Diabetes Res Care. 2020 May;8(1):e001250. doi: 10.1136/bmjdrc-2020-001250. BMJ Open Diabetes Res Care. 2020. PMID: 32393480 Free PMC article.
-
Thalamic amplification of sensory input in experimental diabetes.Eur J Neurosci. 2016 Jul;44(1):1779-86. doi: 10.1111/ejn.13267. Epub 2016 May 30. Eur J Neurosci. 2016. PMID: 27152754 Free PMC article.
-
Unmasking the mysteries of the habenula in pain and analgesia.Prog Neurobiol. 2012 Feb;96(2):208-19. doi: 10.1016/j.pneurobio.2012.01.004. Epub 2012 Jan 14. Prog Neurobiol. 2012. PMID: 22270045 Free PMC article. Review.
-
Contributions of purinergic P2X3 receptors within the midbrain periaqueductal gray to diabetes-induced neuropathic pain.J Physiol Sci. 2015 Jan;65(1):99-104. doi: 10.1007/s12576-014-0344-5. Epub 2014 Nov 1. J Physiol Sci. 2015. PMID: 25367719 Free PMC article.
-
Methylglyoxal modification of Nav1.8 facilitates nociceptive neuron firing and causes hyperalgesia in diabetic neuropathy.Nat Med. 2012 Jun;18(6):926-33. doi: 10.1038/nm.2750. Nat Med. 2012. PMID: 22581285
References
-
- NIH Guide for the care and use of laboratory animals. National Academy Press, Inc.; Washington D.C.: 1996.
-
- Benbow J, Chan AW, Bowsher D, MacFarlane IA, Williams G. A prospective study of painful symptoms, small-fibre function and peripheral vascular disease in chronic painful diabetic neuropathy. Diabet.Med. 1994:17. - PubMed
-
- Biessels GJ. Cerebral complications of diabetes: clinical findings and pathogenetic mechanisms. Netherlands Journal of Medicine. 1999;54:35. [Review] [162 refs] - PubMed
-
- Biessels GJ, Cristino NA, Rutten GJ, Hamers FP, Erkelens DW, Gispen WH. Neurophysiological changes in the central and peripheral nervous system of streptozotocin-diabetic rats. Course of development and effects of insulin treatment. Brain. 1999;122:757. - PubMed
-
- Biessels GJ, Cristino NA, Rutten GJ, Hamers FPT, Erkelens DW, Gispen WH. Neurophysiological changes in the central and peripheral nervous system of streptozotocin-diabetic rats - Course of development and effects of insulin treatment. Brain. 1999;122:757. - PubMed
MeSH terms
Substances
Grants and funding
LinkOut - more resources
Full Text Sources
Medical

