

Restraint-induced fra-2 and c-fos expression in the rat forebrain: relationship to stress duration
- PMID: 17936518
- PMCID: PMC2189738
- DOI: 10.1016/j.neuroscience.2007.09.013
Restraint-induced fra-2 and c-fos expression in the rat forebrain: relationship to stress duration
Abstract
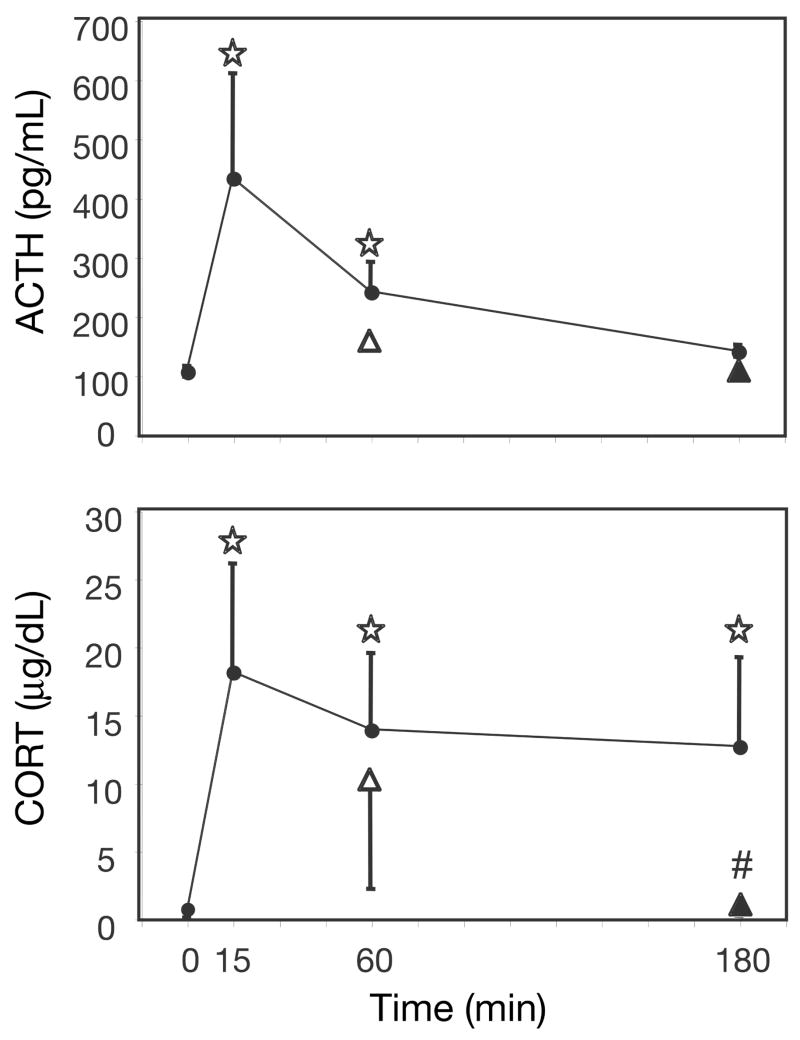
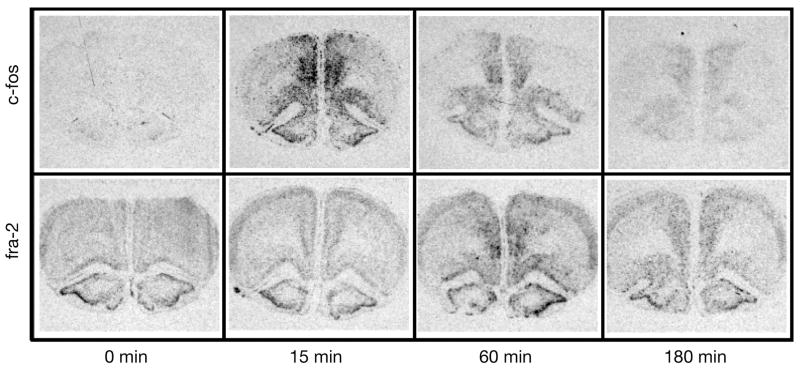
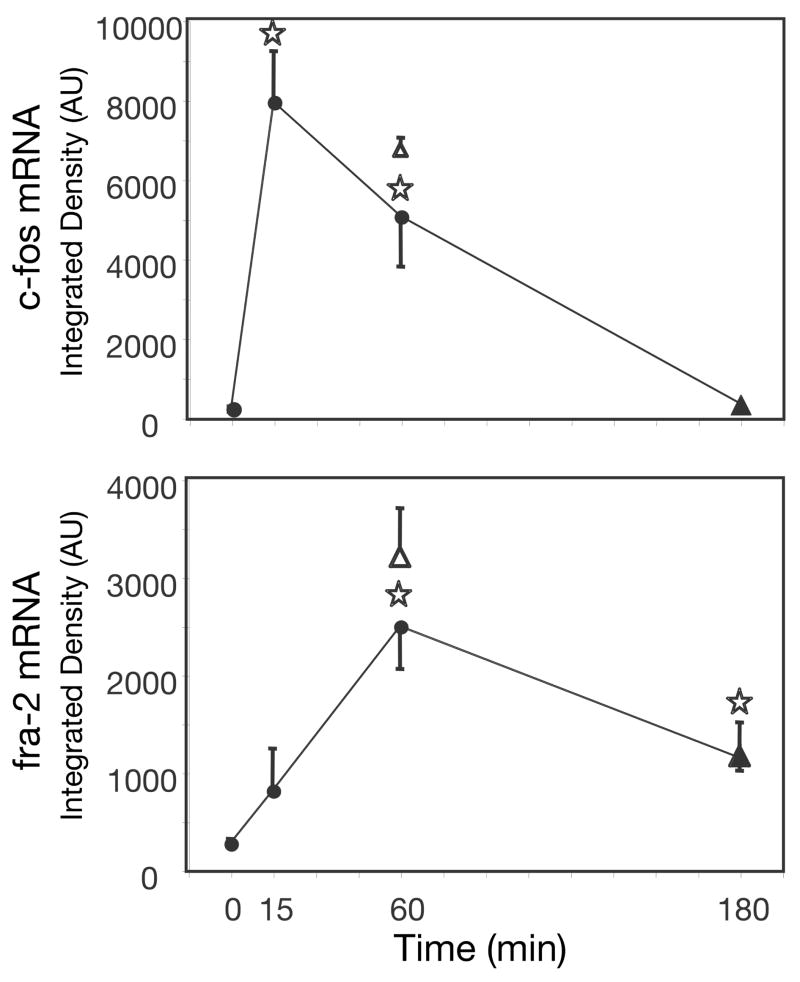
The protein product of the fra-2 gene (Fra-2), a fos-family member, can compete with Fos protein for participation in activating protein-1 (AP-1) transcription factor complexes and each protein can contribute different transactivational consequences to an AP-1 complex. To date, there is limited characterization of fra-2 mRNA expression in the rat forebrain. We examined basal and restraint-induced mRNA expression (in situ hybridization) of fra-2 in the rat forebrain and compared its temporal-spatial pattern to c-fos. In contrast to the very low basal expression of c-fos, fra-2 basal expression was moderately high throughout cortex and some subcortical structures, including prominent basal expression in the hypothalamic paraventricular nucleus (PVN). Restraint-induced fra-2 expression was quantified in the prefrontal cortex (PFC), lateral septum (LS) and PVN. Maximal fra-2 gene induction in the PFC and LS was delayed (60 min) after restraint onset with respect to c-fos (15 min), whereas in the PVN, fra-2 mRNA increased within 15 min of restraint. Additionally we compared c-fos and fra-2 gene expression in rats given shorter or longer restraint durations, but equal total time from stress onset to sample collection, to determine the extent to which the kinetics of gene induction matched that of a hypothalamic-pituitary-adrenal axis hormone response. Rats given 45 min recovery after 15 min restraint showed less c-fos expression in the PVN, less fra-2 expression in the prelimbic and infralimbic PFC, and no difference in the LS compared with rats restrained for 60 min. Thus, the expression of both genes was sensitive to stressor duration, but this sensitivity varied with brain region. Differential basal and stress-induced expression patterns of the fra-2 and c-fos genes are likely to have important functional consequences for AP-1 transcription factor dependent regulation of neural plasticity.
Figures


Similar articles
-
An unexpected increase in restraint duration alters the expression of stress response habituation.Physiol Behav. 2013 Oct 2;122:193-200. doi: 10.1016/j.physbeh.2013.03.029. Epub 2013 Apr 6. Physiol Behav. 2013. PMID: 23566924 Free PMC article.
-
Repeated ferret odor exposure induces different temporal patterns of same-stressor habituation and novel-stressor sensitization in both hypothalamic-pituitary-adrenal axis activity and forebrain c-fos expression in the rat.Endocrinology. 2009 Feb;150(2):749-61. doi: 10.1210/en.2008-0958. Epub 2008 Oct 9. Endocrinology. 2009. PMID: 18845631 Free PMC article.
-
The medial prefrontal cortex differentially regulates stress-induced c-fos expression in the forebrain depending on type of stressor.Eur J Neurosci. 2003 Oct;18(8):2357-64. doi: 10.1046/j.1460-9568.2003.02932.x. Eur J Neurosci. 2003. PMID: 14622198
-
"Green odor" inhalation by rats down-regulates stress-induced increases in Fos expression in stress-related forebrain regions.Neurosci Res. 2009 Oct;65(2):166-74. doi: 10.1016/j.neures.2009.06.012. Epub 2009 Jun 27. Neurosci Res. 2009. PMID: 19563846
-
FRA-1 as a driver of tumour heterogeneity: a nexus between oncogenes and embryonic signalling pathways in cancer.Oncogene. 2015 Aug 20;34(34):4421-8. doi: 10.1038/onc.2014.374. Epub 2014 Nov 10. Oncogene. 2015. PMID: 25381818 Free PMC article. Review.
Cited by
-
Central neural activation following contact sensitivity peripheral immune challenge: evidence of brain-immune regulation through C fibres.Immunology. 2015 Oct;146(2):206-16. doi: 10.1111/imm.12479. Epub 2015 Aug 24. Immunology. 2015. PMID: 25967648 Free PMC article.
-
Treadmill Exercise as a Preventive Measure Against Age-Related Anxiety and Social Behavioral Disorders in Rats: When Is It Worth Starting?Ann Rehabil Med. 2022 Dec;46(6):320-328. doi: 10.5535/arm.22105. Epub 2022 Dec 31. Ann Rehabil Med. 2022. PMID: 36588447 Free PMC article.
-
5-HTT deficiency affects neuroplasticity and increases stress sensitivity resulting in altered spatial learning performance in the Morris water maze but not in the Barnes maze.PLoS One. 2013 Oct 22;8(10):e78238. doi: 10.1371/journal.pone.0078238. eCollection 2013. PLoS One. 2013. PMID: 24167611 Free PMC article.
-
Social and non-social anxiety in adolescent and adult rats after repeated restraint.Physiol Behav. 2009 Jun 22;97(3-4):484-94. doi: 10.1016/j.physbeh.2009.03.025. Epub 2009 Apr 2. Physiol Behav. 2009. PMID: 19345235 Free PMC article.
-
Striatal dopamine and glutamate receptors modulate methamphetamine-induced cortical Fos expression.Neuroscience. 2009 Jul 21;161(4):1114-25. doi: 10.1016/j.neuroscience.2009.04.023. Epub 2009 Apr 15. Neuroscience. 2009. PMID: 19374938 Free PMC article.
References
-
- Beer J, Mielke K, Zipp M, Zimmermann M, Herdegen T. Expression of c-jun, junB, c-fos, fra-1 and fra-2 mRNA in the rat brain following seizure activity and axotomy. Brain Res. 1998;794:255–266. - PubMed
-
- Butler TL, Pennypacker KR. Temporal and regional expression of Fos-related proteins in response to ischemic injury. Brain Res Bull. 2004;63:65–73. - PubMed
-
- Campeau S, Watson SJ. Neuroendocrine and behavioral responses and brain pattern of c-fos induction associated with audiogenic stress. J Neuroendocrinol. 1997;9:577–588. - PubMed
-
- Crane JW, French KR, Buller KM. Patterns of neuronal activation in the rat brain and spinal cord in response to increasing durations of restraint stress. Stress. 2005;8:199–211. - PubMed
-
- Cuevas BD, Uhlik MT, Garrington TP, Johnson GL. MEKK1 regulates the AP-1 dimer repertoire via control of JunB transcription and Fra-2 protein stability. Oncogene. 2005;24:801–809. - PubMed
Publication types
MeSH terms
Substances
Grants and funding
LinkOut - more resources
Full Text Sources
Medical
Molecular Biology Databases
Research Materials
Miscellaneous
