. 2008 Apr 1;63(7):710-20.
doi: 10.1016/j.biopsych.2007.08.003. Epub 2007 Oct 15.

CREB binding and activity in brain: regional specificity and induction by electroconvulsive seizure

Affiliations

CREB binding and activity in brain: regional specificity and induction by electroconvulsive seizure

Keith Quincy Tanis et al. Biol Psychiatry. .

Abstract

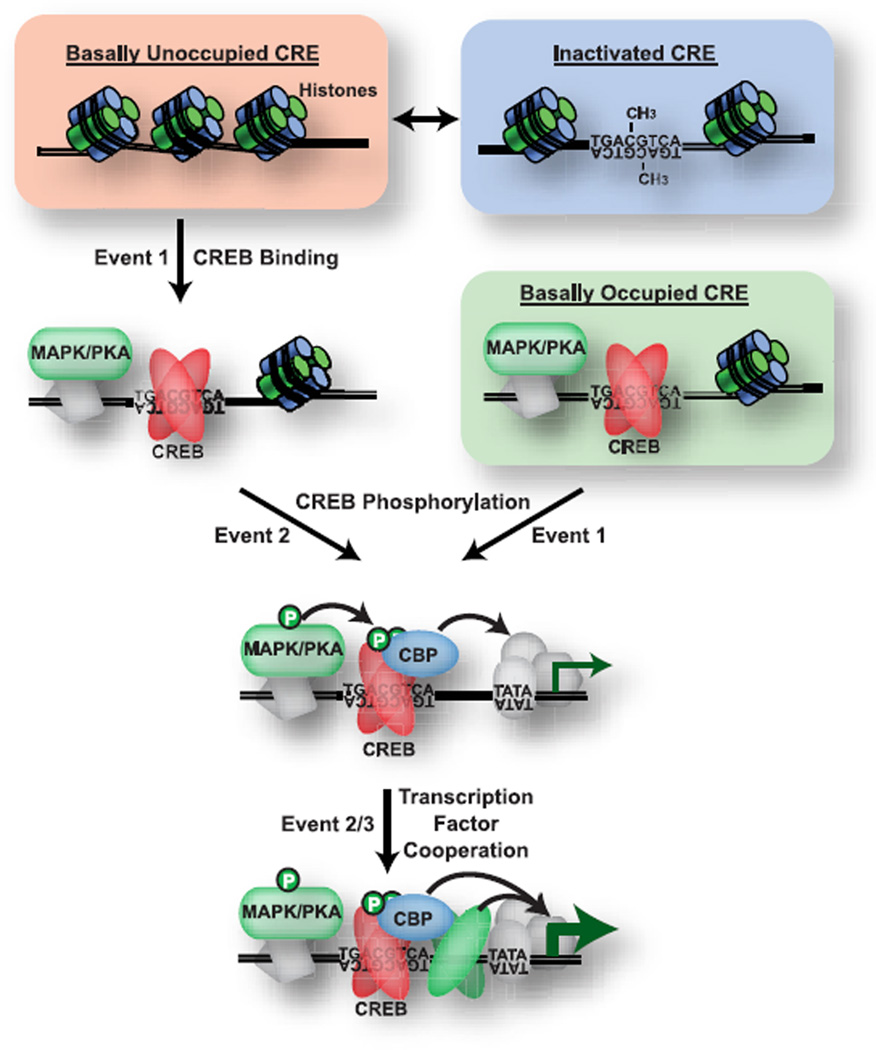
Background: The transcription factor cyclic adenosine monophosphate response element binding protein (CREB) orchestrates diverse neurobiological processes including cell differentiation, survival, and plasticity. Alterations in CREB-mediated transcription have been implicated in numerous central nervous system (CNS) disorders including depression, anxiety, addiction, and cognitive decline. However, it remains unclear how CREB contributes to normal and aberrant CNS function, as the identity of CREB-regulated genes in brain and the regional and temporal dynamics of CREB function remain largely undetermined.

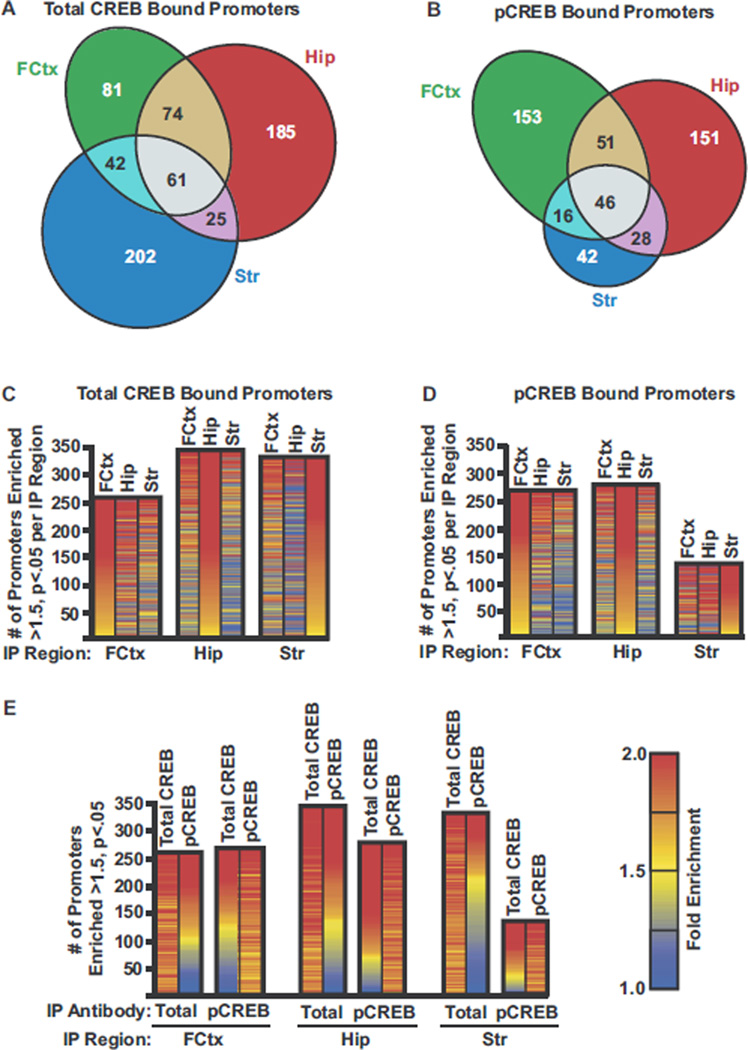
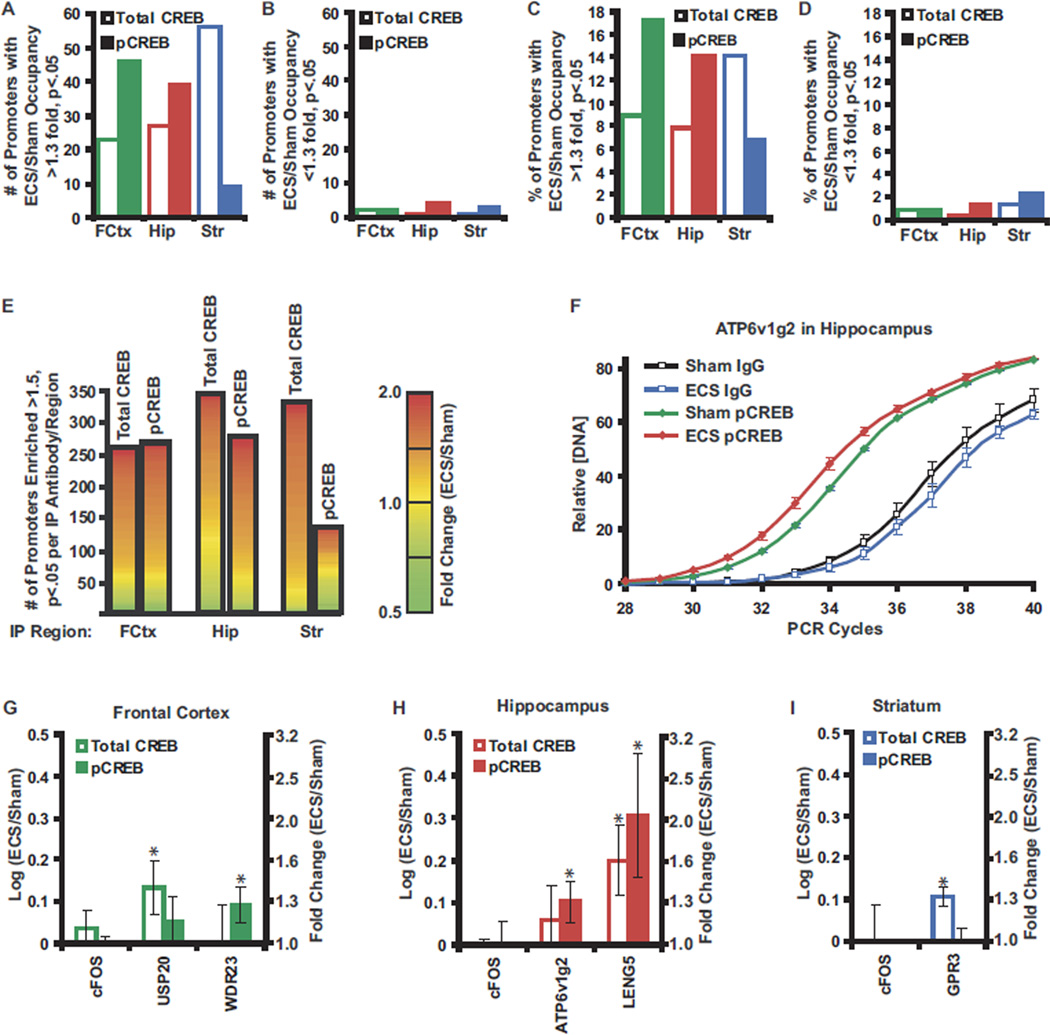
Methods: We combined microarray and chromatin immunoprecipitation technology to analyze CREB-DNA interactions in brain. We compared the occupancy and activity of CREB at gene promoters in rat frontal cortex, hippocampus, and striatum before and after a rodent model of electroconvulsive therapy.

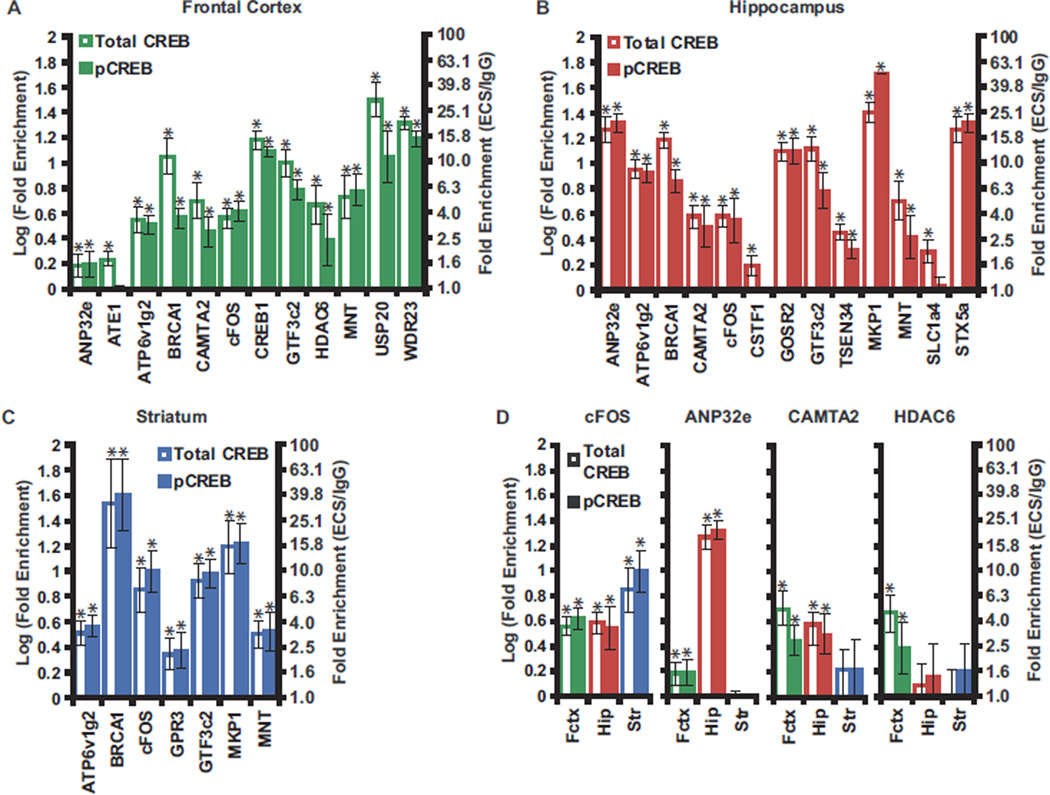
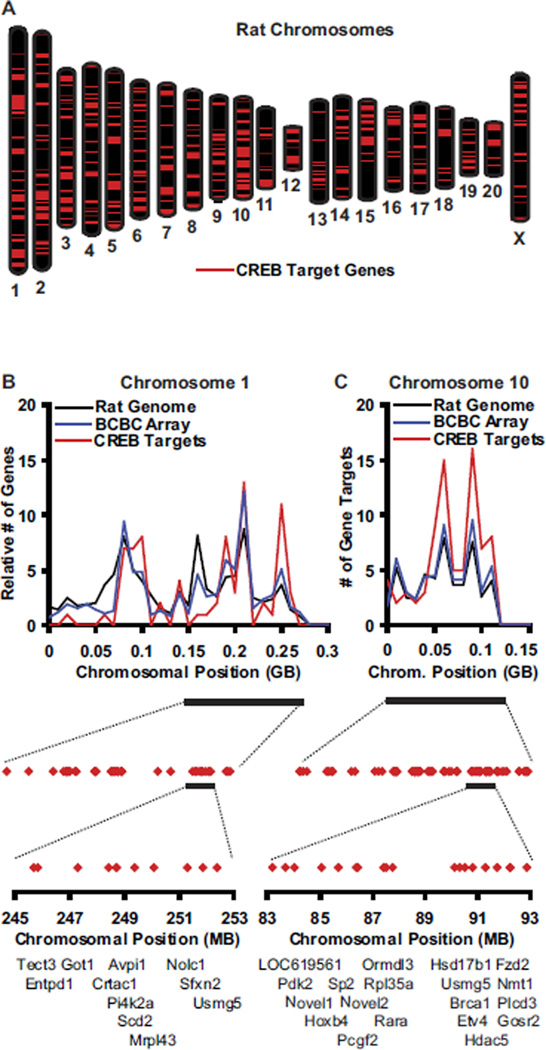
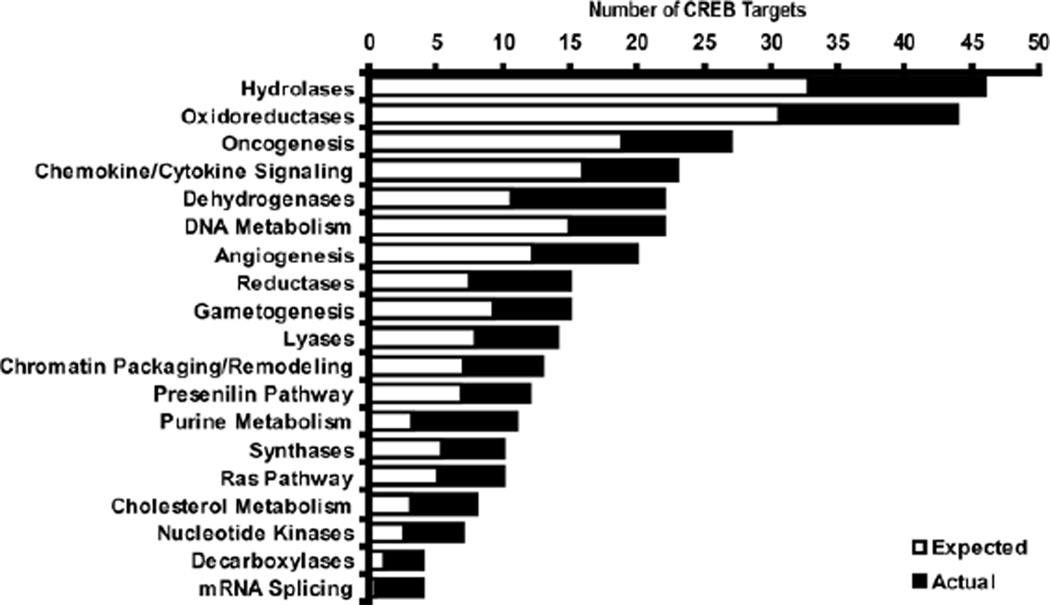
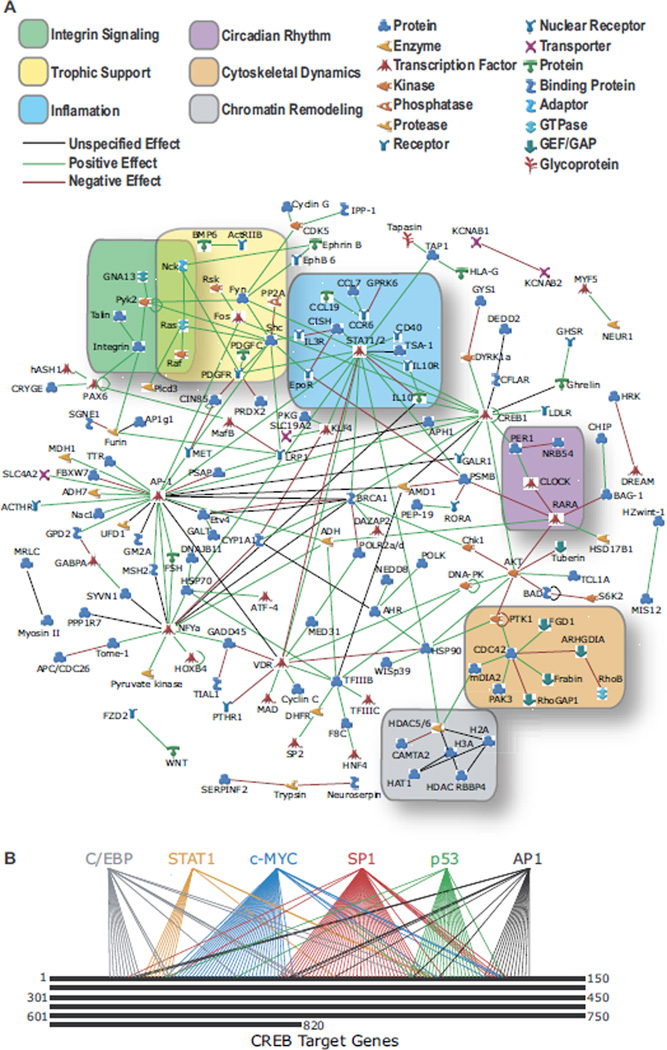
Results: Our analysis identified >860 CREB binding sites in rat brain. We identified multiple genomic loci enriched with CREB binding sites and find that CREB-occupied transcripts interact extensively to promote cell proliferation, plasticity, and resiliency. We discovered regional differences in CREB occupancy and activity that explain, in part, the diverse biological and behavioral outputs of CREB activity in frontal cortex, hippocampus, and striatum. Electroconvulsive seizure rapidly increased CREB occupancy and/or phosphorylation at select promoters, demonstrating that both events contribute to the temporal regulation of the CREB transcriptome.

Conclusions: Our data provide a mechanistic basis for CREB's ability to integrate regional and temporal cues to orchestrate state-specific patterns of transcription in the brain, indicate that CREB is an important mediator of the biological responses to electroconvulsive seizure, and provide global mechanistic insights into CREB's role in psychiatric and cognitive function.


Conflict of interest statement

Dr. Tanis reported no conflicts of interest pertaining to this work. Dr. Duman reported no conflicts of interest pertaining to this work. Dr. Newton reported no conflicts of interest pertaining to this work.

Figures

Figure 1
Figure 1
Immunohistochemistry of CREB expression and phosphorylation in brain. (A,B) Total CREB (A) and pCREB (B) immunohistochemistry performed on 14 µm cryocut ECS treated rat brains. Boxes indicate regions magnified in (D), (G), (H), (F), (I), (J). (C,D) Total CREB immunoreactivity 15 min after sham handling (C) or ECS (D). (E,F) pCREB immunoreactivity 15 min after sham handling (E) or ECS (F). Insets show magnified views of the top blade of the DG. (G,H) Magnified images of the total CREB immunoreactivity in the cortical (G)and striatal (H) regions boxed in (A). (I,J) Magnified images of the pCREB immunoreactivity in the cortical (I) and striatal (J) regions boxed in (B). CA, cornu ammonis; CREB, cyclic adenosine monophosphate (cAMP) response element binding protein; DG, dentate gyrus; ECS, electroconvulsive seizure; pCREB, phospho-Ser-133 CREB.
Figure 2
Figure 2
ChIP-chip analysis of CREB occupancy in brain. (A) Diagram of the biological responses to ECS. ECS activates gene transcription (TXN) to support cell proliferation, growth, and plasticity. (B) Whole brain tissue lysateor the Nonidet-P40 (Sigma-Aldrich, St. Louis, Missouri) insoluble nuclear fraction of whole brain (used for ChIP) was sonicated 20×. Crosslinks were reversed and DNA purified prior to resolving by electrophoresis and staining with ethidium bromide. Whole brain lysates were resistant to shearing; isolated nuclei were consistently sheared into 200 to 500 bp fragments. (C) Whole brain chromatin immunoprecipitated with preimmune IgG, total CREB, or pCREB antibodies; resolved by SDS-PAGE; and immunoblotted using the same total CREB (left panel) or pCREB (right panel) antibodies. (D) Representative image of the BCBC 18K promoter array. For example shown, amplified preimmune IgG and total CREB ChIP product from frontal cortex were labeled with Cy3 (green) and Cy5 (red), respectively. (E) One grid of the array in (D). (F) Scatter plot of Cy3:Cy5 ratios for array in (D). Green = Cy3/Cy5 ratios > 1.5. Red = Cy5/Cy3 >1.5 indicating sequences enriched by total CREB ChIP relative to preimmune IgG ChIP. BCBC, Beta Cell Biology Consortium; bp, base pair; ChIP, chromatin immunoprecipitation; CREB, cyclic adenosine monophosphate (cAMP) response element binding protein; Cy3, cyanine 3; Cy5, cyanine 5; ECS, electroconvulsive seizure; IgG, immunoglobulin G; pCREB, phospho-Ser-133 CREB; SDS-PAGE, sodium dodecyl sulfate polyacrylamide gel electrophoresis.
Figure 3
Figure 3
Identification of CREB bound promoters in hippocampus, frontal cortex, and striatum. (A,B) Venn diagrams showing the number and overlap of promoter sequences enriched (>1.5-fold, p< .05, SAM FDR <5%, n = 6) from frontal cortex (Fctx), hippocampus (Hip), and striatum (Str) of ECS treated rats by total CREB ChIP (A) or pCREBChIP (B) relative to preimmune IgG ChIP. (C,D) Bar graphs show number of sequences enriched (> 1.5-fold, p< .05, SAM FDR < 5%, n = 6) by total CREB (C) or pCREB (D) ChIP relative to preimmune IgG IP from Fctx, Hip, or Str of ECS treated rats. Inside each bar are three heat maps that compare mean enrichment values (total CREB or pCREB ChIP versus preimmune IgG) obtained from frontal cortex (left map), hippocampus (middle map), and striatum (right map) for each promoter represented by the bar graph (blue ≤ 1.0, yellow = 1.5-fold, red ≥ 2-fold, n = 6). (E) Bar graph compares number of sequences enriched by total CREB or pCREB IP per region as in (C,D). Inside each bar are two heat maps that compare mean enrichment values from total CREB (left map) or pCREB ChIP (right map) versus preimmune IgG for each promoter represented by the bar (blue ≤ 1.0, yellow = 1.5-fold, red ≥ 2-fold, n = 6). ChIP, chromatin immunoprecipitation; CREB, cyclic adenosine monophosphate (cAMP) response element binding protein; ECS, electroconvulsive seizure; FDR, false discovery rate; ChIP, chromatin immunoprecipitation; IgG, immunoglobulin G; IP, immunoprecipitation; pCREB, phospho-Ser-133 CREB; SAM, statistical analysis of microarrays.
Figure 4
Figure 4
Real time PCR confirmation of identified CREB targets. (AC) An independent set of unamplified ChIP products from frontal cortex (A), hippocampus (B), and striatum (C) of ECS treated animals were analyzed by real time PCR to confirm enrichment of CREB targets identified by ChIP-chip. Gene names indicate gene most proximal to examined sequence (within 3 kb). Plotted values are log10 of the fold enrichment of each promoter. Fold enrichment equals the ratio of the promoter concentration in the total CREB (open bars) or pCREB (shaded bars) IP to the promoter concentration in the corresponding preimmuneIgG IP. Values are mean ± standard error, n = 6.* indicates Student t test p value of < .05 obtained by comparing PCR cycle numbers from IgGand antibody ChIP. Approximate fold enrichment values are given for reference. c-FOS, BRCA1, MKP1,and CREB1 are known CREB targets in many systems and were examined as positive controls. The other 19 promoters examined for enrichment by PCR (Supplement 3) were chosen randomly from the identified CREB targets. Fifteen of these 19 promoters were significantly enriched in the real time PCR experiments. (D) Comparison of enrichment of the indicated promoter in total CREB (open bars) or pCREB (shaded bars) ChIPs from frontal cortex, hippocampus, and striatum. Data were obtained, plotted, and colored as in (A–C). BRCA1, breast cancer gene 1; c-FOS, v-fos FBJ murine osteosarcoma viral oncogene homolog; ChIP, chromatin immunoprecipitation; CREB, cyclic adenosine monophosphate (cAMP) response element binding protein; CREB1, cyclic adenosine monophosphate response element binding protein 1; ECS, electroconvulsive seizure; IgG, immunoglobulin G; IP, immunoprecipitation; kb, kilobase; MKP1, MAP kinase phosphatase 1; pCREB, phospho-Ser-133 CREB; PCR, polymerase chain reaction.
Figure 5
Figure 5
Genomic map of the CREB regulon. (A) Positions of the identified CREB target genes (red lines) on rat chromosomes. Base pair numbering begins at top of chromosome. (B,C) Number of CREB targets identified (red) per 10 Mb of chromosomes 1 (B) and 10 (C) compared with the expected number of CREB targets given a random distribution of the 820 CREB targets and the number of genes per each 10 Mb region in the rat genome (black) or on the BCBC array (blue). A 120 Mb region of each chromosome is expanded to show the distribution of identified CREB targets (red diamonds). These regions are further expanded to show example CREB target clusters. MGI gene symbols are given, Novel1 = 5730593F17Rik, Novel2 = E130012A19Rik. See Supplement 2 for other chromosomes. BCBC, Beta Cell Biology Consortium; CREB, cyclic adenosine monophosphate (cAMP) response element binding protein; Mb, megabase; MGI, Mouse Genome Informatics.
Figure 6
Figure 6
Functional characterization of CREB target genes. The 820 CREB target genes were analyzed using the Panther Classification System. Panther categories enriched (binomial p< .05) in the CREB target list compared with all promoters present on the array are given.These categories are given as examples. They are not overrepresented in the list when accounting for multiple ontology comparisons, demonstrating the highly diversified biological functions of the CREB targets. Open bars indicate the number of genes from each category expected by chance based on the number of genes printed on the array from each category. Closed bars indicate the actual number of genes from each category with CREB binding sites identified in their promoters. CREB, cyclic adenosine monophosphate (cAMP) response element binding protein.
Figure 7
Figure 7
The CREB interactome. (A) The 820 identified CREB targets were analyzed for direct interactions using GeneGo (Metacore, Kanata, Ontario, Canada). Network includes all CREB targets reported in the curated literature to interact directly withatleast one otherofthe identified CREB targets. Network connections specify positive (green), negative (red),or unspecified (black) interactions. Gene functional classes are categorized by symbols shown. Nodes are clustered into several biological functionsas highlighted. (B) Diagram depicts the number of identified CREB targets known to be transcriptionally regulated by C/EBP, STAT1, c-Myc, SP1, p53, and/or AP1. AP1, activator protein 1; C/EBP, CCAAT/enhancer binding protein; c-Myc, v-myc myelocytomatosis viral oncogene homolog; CREB, cyclic adenosine monophosphate (cAMP) response element binding protein; SP1, specificity protein 1;STAT1, signal transducer and activatorof transcription 1;p53, p53 tumor suppressor.
Figure 8
Figure 8
Acute enhancement of CREB occupancy and phosphorylation by ECS. (A,B) Bar chart showing the number of promoter sequences with > 1.3-fold, p< .05, SAM FDR < 5% enhancement (A) or reduction (B) in quantity immunoprecipitated 15 min following ECS relative to sham handled animals for either the total CREB (open bars) or pCREB (shaded bars) antibody in the indicated brain regions (n= 6). (C,D) Data in A (C) and B (D) plotted as the percent of the total number of promoters occupied by total CREB or pCREB in each region. (E) Bar graph showing number of sequences enriched > 1.5-fold, p< .05, SAM FDR < 5% by total CREB or pCREB ChIP relative to preimmune IgG ChIP from each region. Heat maps give the ratio of the promoter quantity immunoprecipitated between ECS and sham treated animals for each promoter represented by the bar (green: ECS/sham ≤ .5; yellow: ECS/sham = 1.0; red: ECS/sham ≥ 2; mean, n=6). (F) Real time PCR analysis of ATP6v1g2 promoter concentrations in unamplified ChIP product from pCREB or preimmune IgG IPs from hippocampus 15 min following ECS or sham treatment. Open squares indicate data obtained from preimmune IgG IPs from sham (black) and ECS (blue) treated animals. Closed triangles indicate data obtained from pCREB IPs from sham (green) and ECS (red) treated animals. Values are mean ± standard error, n = 6. (G–I) Real time PCR analysis comparing unamplified ChIP product from frontal cortex (G), hippocampus (H), and striatum (I) of sham and ECS treated animals. Values are log10 of the ratio of the promoter concentration in ChIPsfrom ECS treated animals to its concentration in ChIPsfrom sham treated animals. Open bars indicate total CREB ChIPs. Shaded bars indicate pCREB ChIPs. Values are mean ± standard error, n = 6. * indicates Student t test p value of < .05. Approximate fold changes are given for reference. ChIP, chromatin immunoprecipitation; CREB, cyclic adenosine monophosphate (cAMP) response element binding protein; ECS, electroconvulsive seizure; FDR, false discovery rate; IgG, immunoglobulin G; IP, immunoprecipitation; pCREB, phospho-Ser-133 CREB; PCR, polymerase chain reaction; SAM, statistical analysis of microarrays.
Figure 9
Figure 9
Model of dynamic control over the CREB regulon. Three potential CRE states are proposed under basal conditions: 1) unoccupied by CREB, 2) occupied by CREB, and 3) stably inactivated, for example by methylation (CH3). These states contributeto the regional and developmental specificity of the CREB regulon and have different requirements for transcriptional activation. CRE sites occupied under basal conditions require only CREB phosphorylation to trigger transcription. Basally unoccupied CRE sites require two independent events to activate transcription: 1) initiation ofCREB binding, and2)CREB phosphorylation, allowing the integration of cues from two different cellular events. While our experiments find that CREB phosphorylation can occur after binding, the reverse order is also likely to occur. Kinases may physically associate with and activate CREB at specific promoters. CREB cooperates with other transcription factors to provide an additional levelof transcriptional control. CRE,cyclic adenosinemonophosphate (cAMP) response element; CREB, cyclic adenosine monophosphate (cAMP) response element binding protein.

Similar articles

Cited by

References

    1. Shaywitz A, Greenberg ME. CREB: A stimulus-induced transcription factor activated by a diverse array of extracellular signals. Annu Rev Biochem. 1999;68:821–861. - PubMed
    1. Lonze BE, Ginty DD. Function and regulation of CREB family transcription factors in the nervous system. Neuron. 2002;35:605–623. - PubMed
    1. Carlezon WA, Jr., Duman RS, Nestler EJ. The many faces of CREB. Trends Neurosci. 2005;28:436–445. - PubMed
    1. Mayr B, Montminy M. Transcriptional regulation by the phosphorylation-dependent factor CREB. Nat Rev Mol Cell Biol. 2001;2:599–609. - PubMed
    1. Zhang X, Odom DT, Koo SH, Conkright MD, Canettieri G, Best J, et al. Genome-wide analysis of cAMP-response element binding protein occupancy, phosphorylation, and target gene activation in human tissues. Proc Natl Acad Sci U S A. 2005;102:4459–4464. - PMC - PubMed

Publication types

MeSH terms

Substances