Changes in growth factor expression in normal aging of the rat retina
- PMID: 17936752
- PMCID: PMC2189956
- DOI: 10.1016/j.exer.2007.08.017
Changes in growth factor expression in normal aging of the rat retina
Abstract
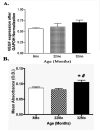
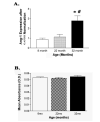
Although much is known about the growth factor changes in ocular tissues during various diseases, little is known about normal aging of the retina. In order to further understand normal aging in the retina, we characterized age-related changes of growth factor expression in three different ages of rat retina. Real time PCR and protein analysis was conducted to investigate steady state mRNA expression and protein levels of VEGF, VEGFR2, PEDF, Ang-1, Tie-2, EphB4 and ephrinB2 in the retina of 8-, 22-, and 32-month-old Brown Norway X Fischer 344 F1 hybrid rats. An increase of VEGF protein levels was found at 32months compared to 8 and 22months of age. VEGFR2 protein was found to be increased at 22 and 32months compared to 8months. PEDF protein levels were reduced at 22 and 32months. Tie-2 levels were found to be significantly decreased by 32months compared to 8months of age, while ephrinB2 was found to be significantly lower at both 22 and 32months compared to 8months of age. The increases found in VEGF and its receptor VEGFR2, with the simultaneous decrease of PEDF protein levels, may stimulate an environment that is well suited for neovascularization in the normal aging retina. Overall, these results suggest that normal aging produces substantial changes in gene expression and protein levels.
Figures


Similar articles
-
Age-associated increase in cleaved caspase 3 despite phosphorylation of IGF-1 receptor in the rat retina.J Gerontol A Biol Sci Med Sci. 2009 Nov;64(11):1154-9. doi: 10.1093/gerona/glp102. Epub 2009 Aug 20. J Gerontol A Biol Sci Med Sci. 2009. PMID: 19696229 Free PMC article.
-
Normal aging involves altered expression of growth factors in the rat choroid.J Gerontol A Biol Sci Med Sci. 2008 Feb;63(2):135-40. doi: 10.1093/gerona/63.2.135. J Gerontol A Biol Sci Med Sci. 2008. PMID: 18314447
-
Increased angiogenic factors associated with peripheral avascular retina and intravitreous neovascularization: a model of retinopathy of prematurity.Arch Ophthalmol. 2010 May;128(5):589-95. doi: 10.1001/archophthalmol.2010.65. Arch Ophthalmol. 2010. PMID: 20457980 Free PMC article.
-
Age-related alterations in retinal neurovascular and inflammatory transcripts.Mol Vis. 2011;17:1261-74. Epub 2011 May 7. Mol Vis. 2011. PMID: 21633715 Free PMC article.
-
Studies on the pathogenesis of avascular retina and neovascularization into the vitreous in peripheral severe retinopathy of prematurity (an american ophthalmological society thesis).Trans Am Ophthalmol Soc. 2010 Dec;108:96-119. Trans Am Ophthalmol Soc. 2010. PMID: 21212851 Free PMC article. Review.
Cited by
-
Identification of PLXDC1 and PLXDC2 as the transmembrane receptors for the multifunctional factor PEDF.Elife. 2014 Dec 23;3:e05401. doi: 10.7554/eLife.05401. Elife. 2014. PMID: 25535841 Free PMC article.
-
Identification of Potential Key lncRNAs and Genes Associated with Aging Based on Microarray Data of Adipocytes from Mice.Biomed Res Int. 2016;2016:9181702. doi: 10.1155/2016/9181702. Epub 2016 Dec 21. Biomed Res Int. 2016. PMID: 28097151 Free PMC article.
-
γ-Secretase inhibition of murine choroidal neovascularization is associated with reduction of superoxide and proinflammatory cytokines.Invest Ophthalmol Vis Sci. 2012 Feb 1;53(2):574-85. doi: 10.1167/iovs.11-8728. Print 2012 Feb. Invest Ophthalmol Vis Sci. 2012. PMID: 22205609 Free PMC article.
-
Systemic propranolol reduces b-wave amplitude in the ERG and increases IGF-1 receptor phosphorylation in rat retina.Invest Ophthalmol Vis Sci. 2010 May;51(5):2730-5. doi: 10.1167/iovs.09-4779. Epub 2009 Dec 30. Invest Ophthalmol Vis Sci. 2010. PMID: 20042659 Free PMC article.
-
Age-associated increase in cleaved caspase 3 despite phosphorylation of IGF-1 receptor in the rat retina.J Gerontol A Biol Sci Med Sci. 2009 Nov;64(11):1154-9. doi: 10.1093/gerona/glp102. Epub 2009 Aug 20. J Gerontol A Biol Sci Med Sci. 2009. PMID: 19696229 Free PMC article.
References
-
- Adamis AP, Miller JW, Bernal MT, D’Amico DJ, Folkman J, Yeo TK, Yeo KT. Increased vascular endothelial growth factor levels in the vitreous of eyes with proliferative diabetic retinopathy. Am J Ophthalmol. 1994;118(4):445–50. - PubMed
-
- Aiello LP, Avery RL, Arrigg PG, Keyt BA, Jampel HD, Shah ST, Pasquale LR, Thieme H, Iwamoto MA, Park JE. Vascular endothelial growth factor in ocular fluid of patients with diabetic retinopathy and other retinal disorders. N Engl J Med. 1994;331(22):1480–1487. - PubMed
-
- Bonnel S, Mohand-Said S, Sahel JA. The aging of the retina. Exp Gerontol. 2003;38(8):825–31. - PubMed
-
- Chan-Ling T, Gock B, Stone J. The effect of oxygen on vasoformative cell division. Evidence that ‘physiological hypoxia’ is the stimulus for normal retinal vasculogenesis. Invest Ophthalmol Vis Sci. 1995;36(7):1201–14. - PubMed
Publication types
MeSH terms
Substances
Grants and funding
LinkOut - more resources
Full Text Sources
Medical
Molecular Biology Databases
Research Materials
Miscellaneous

