

doi: 10.1016/j.jss.2007.02.053.
Epub 2007 Oct 22.
Analysis of variance: is there a difference in means and what does it mean?
Affiliations
- PMID: 17936790
- PMCID: PMC2405942
- DOI: 10.1016/j.jss.2007.02.053
Item in Clipboard
Analysis of variance: is there a difference in means and what does it mean?
J Surg Res.
2008 Jan.
Abstract
To critically evaluate the literature and to design valid studies, surgeons require an understanding of basic statistics. Despite the increasing complexity of reported statistical analyses in surgical journals and the decreasing use of inappropriate statistical methods, errors such as in the comparison of multiple groups still persist. This review introduces the statistical issues relating to multiple comparisons, describes the theoretical basis behind analysis of variance (ANOVA), discusses the essential differences between ANOVA and multiple t-tests, and provides an example of the computations and computer programming used in performing ANOVA.
Figures
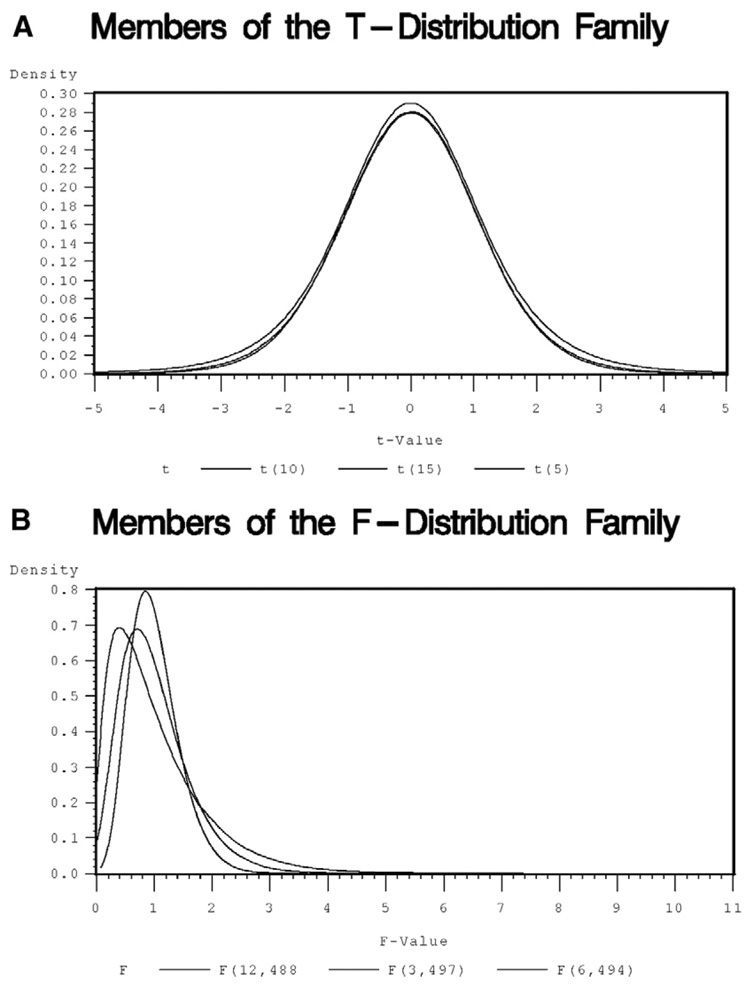
(A) The student’s t-distribution is similar to a normal or Gaussian distribution except that the sample standard deviation is used instead of the population standard deviation. The critical value indicating statistical significance can be either positive or negative. (B) The F-distribution is a binomial distribution. The critical value is always positive.
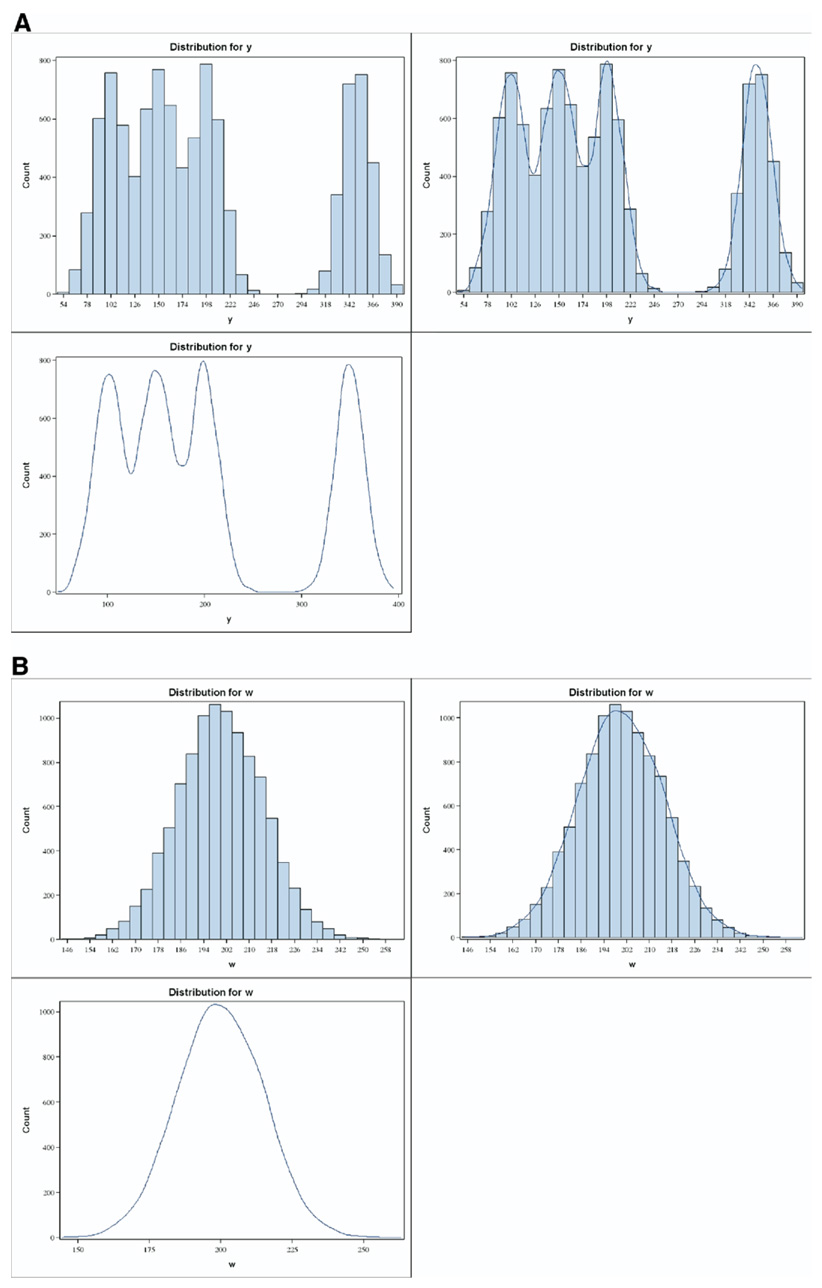
A graphical representation of ANOVA: suppose that there are four groups of 2500 data points each. Two different possible scenarios are represented. (A) The means of the four groups are 100, 150, 200, and 350. The histograms and overlying curves, representing the distributions of each group, demonstrate clearly that the mean of one group is different from that of the other three. In this case, the F-test would be statistically significant, prompting further exploration of the differences. (B) The mean of all four groups is 200. The overlying curve demonstrates that a single mean characterizes the entire population. In this case, the F-test would not be statistically significant, precluding further testing for differences. (Color version of figure is available online.)
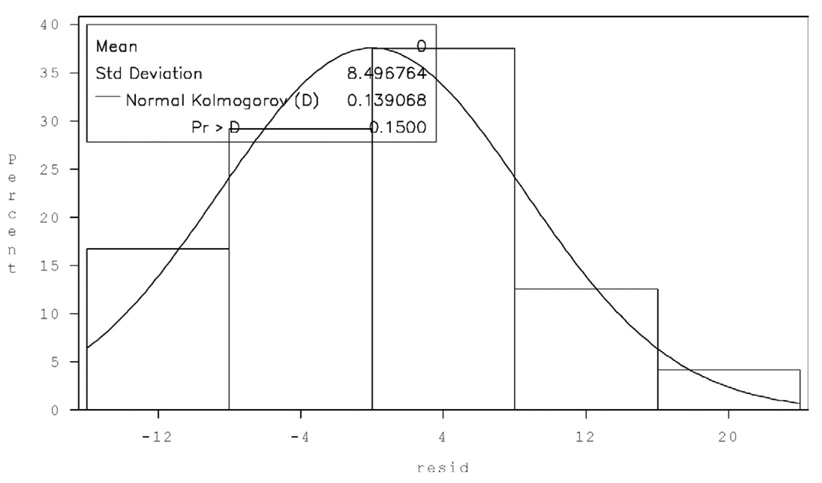
The histogram of the residuals follows a normal distribution. The Kolmogorov-Smirnov test result also confirms the assumption of normality.
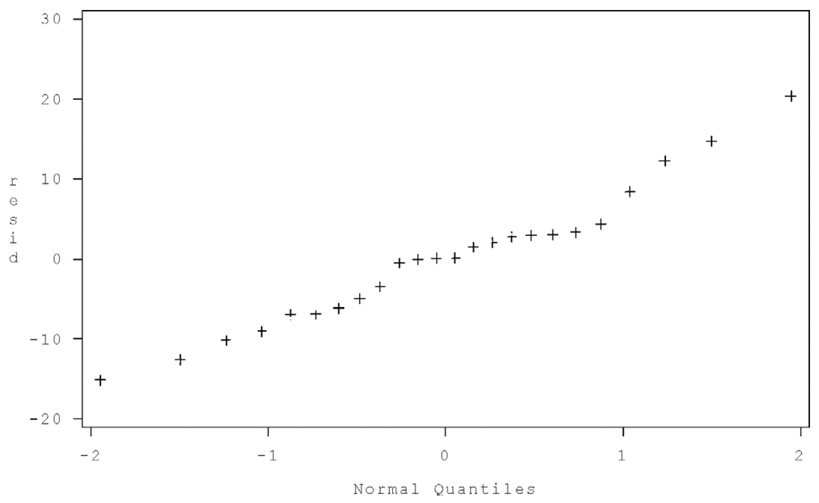
The QQ plot or quantile-quantile plot, which graphs quantiles from a normal distribution on the x-axis and quantiles of the residuals, on the y-axis appears to be a straight line. The QQ plot provides additional confirmation of the assumption of normality.
References
-
- Reznick RK, Dawson-Saunders E, Folse JR. A rationale for the teaching of statistics to surgical residents. Surgery. 1987;101:611. - PubMed
-
- Cheatham ML. A structured curriculum for improved resident education in statistics. Am Surg. 2000;66:585. - PubMed
-
- Emerson JD, Colditz GA. Use of statistical analysis in the New England Journal of Medicine. N Engl J Med. 1983;309:709. - PubMed
-
- Feinstein AR. Clinical biostatistics. XXV. A survey of the statistical procedures in general medical journals. Clin Pharmacol Ther. 1974;15:97. - PubMed
-
- Kurichi JE, Sonnad SS. Statistical methods in the surgical literature. J Am Coll Surg. 2006;202:476. - PubMed
Publication types
MeSH terms
Grants and funding
LinkOut - more resources
Full Text Sources
