. 2008 Jan 20;370(2):310-22.
doi: 10.1016/j.virol.2007.08.038. Epub 2007 Oct 15.

Generation and maintenance of Listeria-specific CD8+ T cell responses in perforin-deficient mice chronically infected with LCMV

Affiliations

Generation and maintenance of Listeria-specific CD8+ T cell responses in perforin-deficient mice chronically infected with LCMV

Troy D Humphreys et al. Virology. .

Abstract

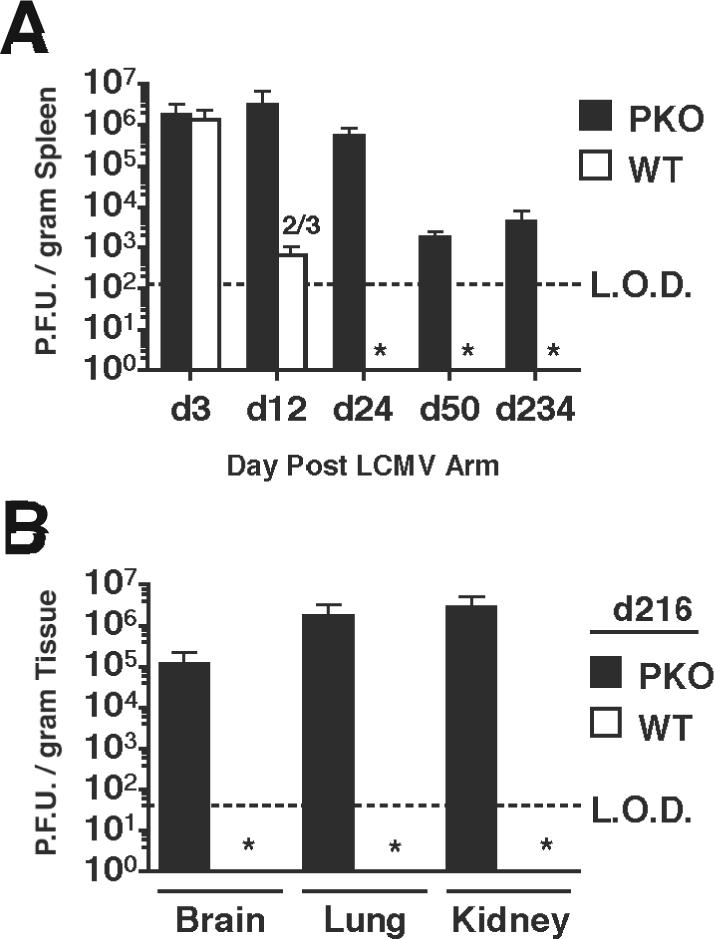
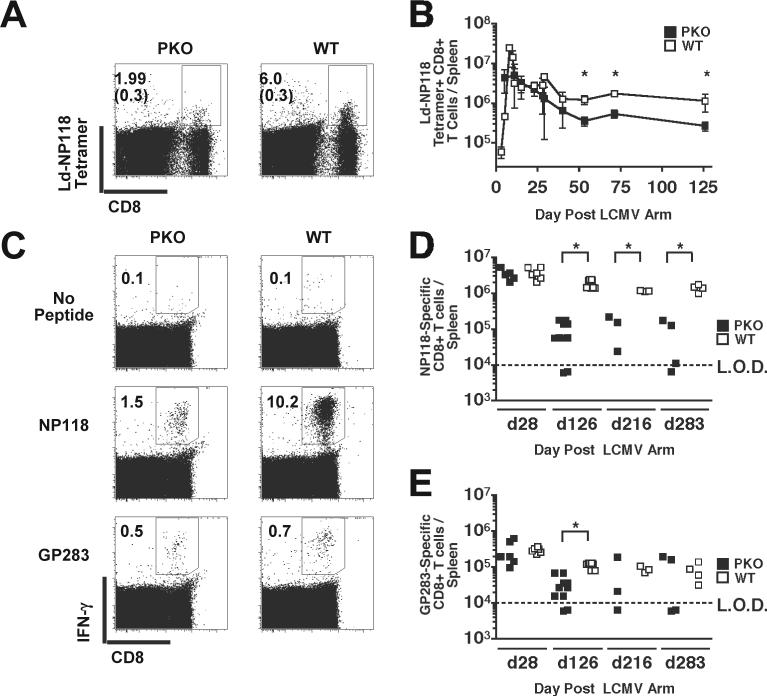
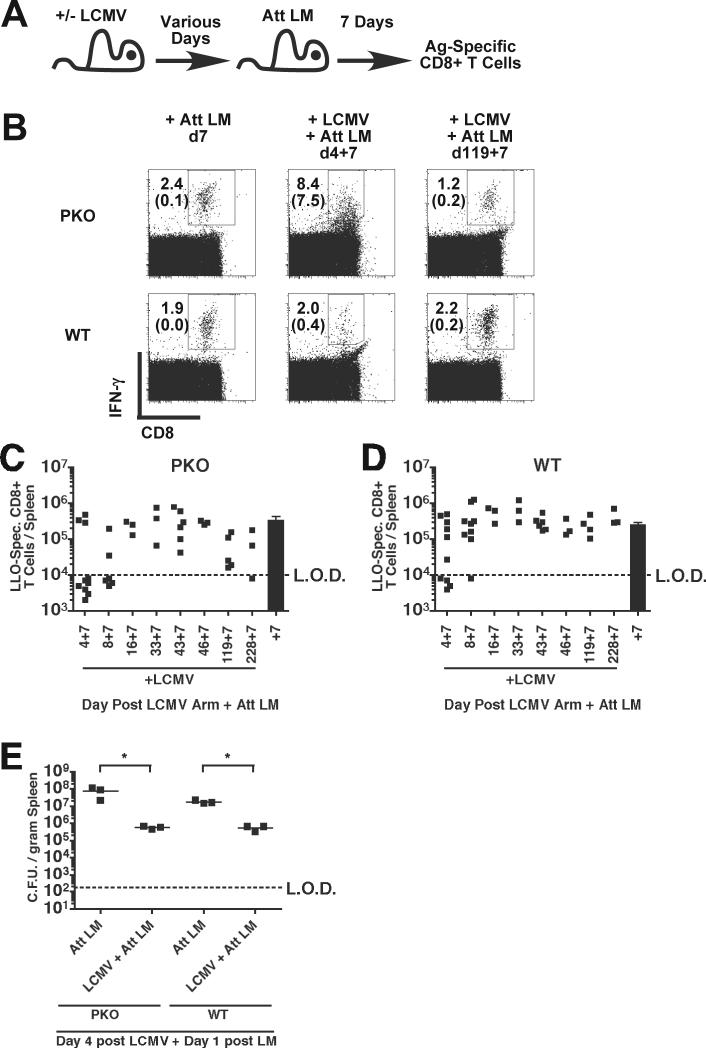
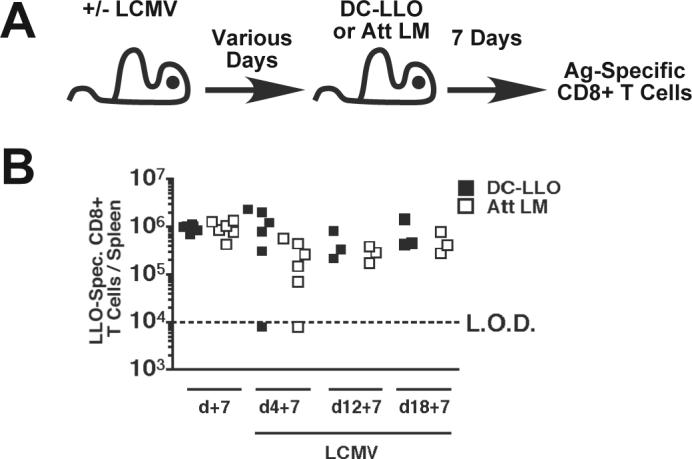
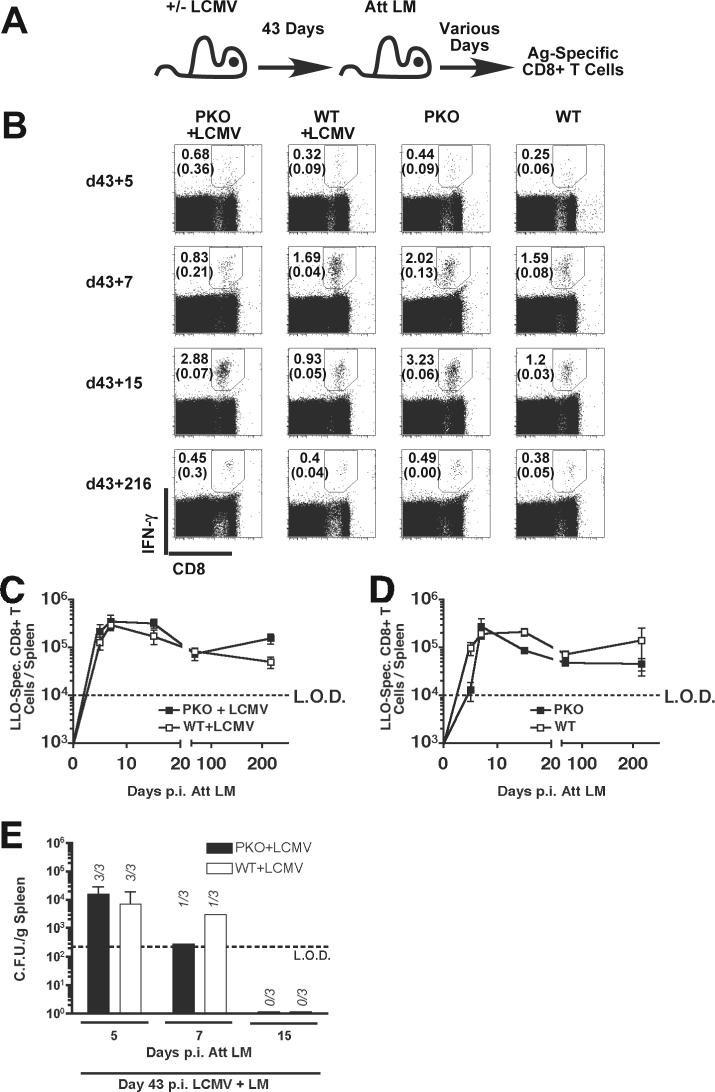
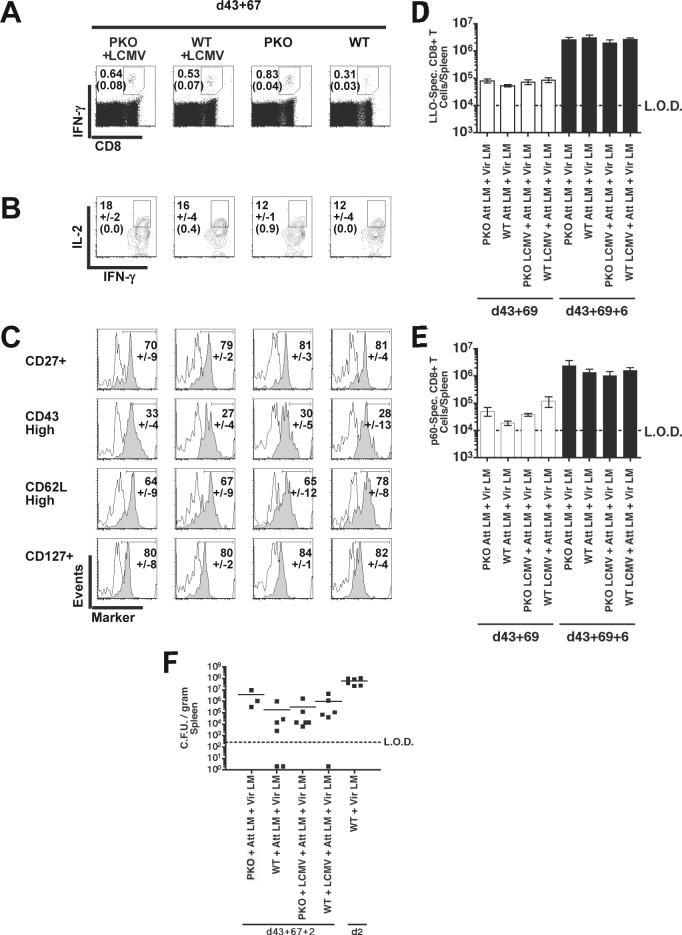
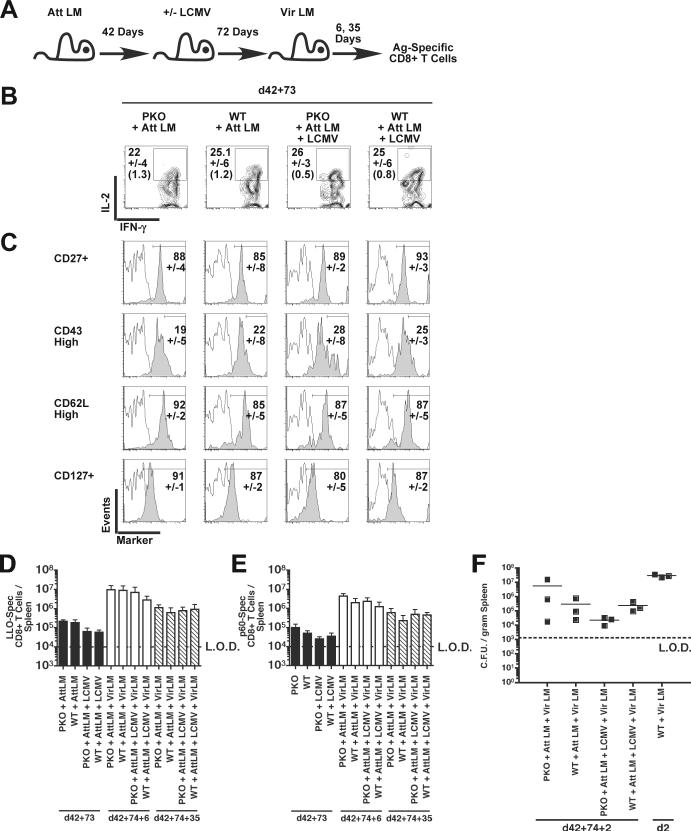
Disruption of the perforin gene results in primary immunodeficiency and an increased susceptibility to opportunistic pathogens. Perforin-deficient (PKO) mice fail to clear primary lymphocytic choriomeningitis virus (LCMV) Armstrong, resulting in persistent infection and functional exhaustion of virus-specific CD8+ T cells. CD8+ T cell responses to Listeria monocytogenes (LM) challenge within the first week after LCMV infection were diminished in both WT and PKO mice, and correlated with enhanced bacterial clearance. However, bacterial challenge at later time points generated similar CD8 T cell responses in both groups of mice. The phenotype and function of pre-existing LM-specific memory CD8+ T cells were maintained in persistently infected PKO mice. Thus persistent LCMV infection, as a result of perforin deficiency, results in dysfunction of the virus-specific CD8+ T cell response but does not compromise the host's ability to maintain pre-existing memory CD8+ T cells or to generate new memory CD8+ T cell responses against other pathogens.


Figures

Figure 1
Figure 1
Virus titers in LCMV-infected mice. BALB/c WT and BALB/c PKO mice were infected intraperitoneally with 2×10⁵ PFU of LCMV ARM. (A) Mean +/− SD PFU/gram of spleen from 3−4 mice/group were determined at the indicated days p.i. Data was pooled from 4 individual experiments. Dashed line indicates the limit of detection (LOD). Numbers indicate mice/group with viral titers above the limit of detection. * below limit of detection in all mice. (B) Mean +/− SD PFU/gram of brain, lung, and kidney from 3 mice/group in BALB/c PKO and BALB/c WT mice at day 216 p.i.
Figure 2
Figure 2
BALB/c WT and BALB/c PKO mice were infected with 2×10⁵ PFU of LCMV Arm i.p. and analyzed at various days p.i. (A) Detection of NP118−126 –specific CD8+ T cell responses in LCMV-infected mice by H-2Ld-NP118 tetramer staining. Representative dot plots from splenocytes harvested at day 53 p.i. Numbers represent percentages of H-2Ld-NP118 tetramer positive CD8+ T cells; background staining in uninfected PKO and WT control mice are in parenthesis. (B) Mean total number +/− SD of H-2Ld-NP118-specific CD8+ cells/spleen, from >3 mice/group, at the indicated day p.i. Data was pooled from 8 individual experiments. * p ≤ 0.05. (C) Functional assessment of virus-specific CD8+ T cell responses in LCMV-infected mice. CD8+ T cell responses to the dominant NP118−126 and the subdominant GP283−291 peptides were analyzed by peptide-stimulated ICS at various times p.i. Representative dot plots from unstimulated and peptide-stimulated splenocytes harvested at day 120 p.i. Total number of (D) NP118−126 –specific and (E) GP283−291 –specific CD8+ T cells/spleen at the indicated day p.i. Each symbol represents an individual mouse (n = 3−10 mice / time point). Data was pooled from 2 individual experiments. Dashed line indicates the LOD. * p ≤ 0.05.
Figure 3
Figure 3
Primary L. monocytogenes –specific CD8+ T cell responses and bacterial clearance in LCMV-infected mice. (A) Experimental design. BALB/c PKO and BALB/c WT mice were infected with 2×10⁵ PFU of LCMV Arm i.p. and were subsequently infected with 3×10⁶ colony forming units (CFU) of actA-deficient L. monocytogenes (Att LM) at the indicated day after LCMV infection. L. monocytogenes LLO91−99 –specific CD8+ T cell responses were determined 7 days after Att LM infection. (B) Representative dot plots from infected mice. Numbers represent the percentage of CD8+ T cells that produce IFN-γ after incubation with (top number) or without (lower number) LLO91−99 peptide. Total number of LLO91−99 – specific CD8+ T cells/spleen in (C) BALB/c PKO and (D) BALB/c WT mice. Each symbol represents an individual mouse (n = 3−10 mice / time point). Dashed line indicates the LOD. Solid bar represents mean responses (+/− SEM) in LCMV-naïve control mice. Data was pooled from 8 individual experiments. (E) BALB/c PKO and BALB/c WT mice were infected with LCMV Arm, 4 days later were infected with Att LM, and the number of bacteria per spleen determined 1 day after infection. Each symbol represents an individual mouse (n = 3 mice / time point). Lines indicate the mean CFU/gram spleen. * p ≤ 0.05.
Figure 4
Figure 4
CD8+ T cell responses to peptide-coated dendritic cells and Att LM infection in LCMV-infected mice. (A) Experimental design. BALB/c PKO and BALB/c WT mice were infected with 2×10⁵ PFU of LCMV Arm i.p. At days 7, 12, or 18 post LCMV infection these mice and LCMV-naïve control mice were injected with 3×10⁶ CFU Att LM or LLO91−99 – coated dendritic cells (DC-LLO). CD8+ T cell responses to LLO91−99 and NP118−126 were analyzed by ICS 7 days later. (B) Total number of LLO91−99 –specific CD8+ T cells/spleen at the indicated time point. Each symbol represents an individual mouse (n = 3−6 mice / time point). Data was pooled from 2 individual experiments. Dashed line indicates the LOD.
Figure 5
Figure 5
Generation of memory LLO91−99 –specific CD8+ T cell responses in LCMV-infected mice. (A) Experimental design. BALB/c PKO and BALB/c WT mice were infected with 2×10⁵ PFU of LCMV Arm i.p. and 43 days later were infected with 3×10⁶ CFU of Att LM. CD8+ T cell responses were then analyzed at the indicated time points after infection by LLO91−99 –stimulated ICS. (B) Representative dot plots from infected mice. Numbers represent the percentage of CD8+ T cells that produce IFN-γ after incubation with (top number) or without (lower number) LLO91−99. Mean, +/− SEM, total number of LLO91−99 – specific CD8+ T cells/spleen of 4−5 mice/group in mice that were (C) infected with LCMV or (D) were not infected with LCMV. Data was pooled from 2 individual experiments. Dashed line indicates the LOD. (E) The mean (+/− SD) number of bacteria per spleen was determined 5, 7, 15 days after LM infection in BALB/c PKO and BALB/c WT mice infected with LCMV 43 days prior to LM infection. Numbers indicate mice/group with detectable LM loads (n = 3 mice / group). Dashed line indicates the limit of detection (LOD).
Figure 6
Figure 6
Phenotype and expansion of memory LLO91−99 –specific CD8+ T cells generated in LCMV-infected mice. BALB/c PKO and BALB/c WT mice were infected with 2×10⁵ PFU of LCMV Arm i.p., 43 days later LCMV-infected mice and naïve control mice were vaccinated with 3×10⁶ CFU of Att LM. At day 69 after LM vaccination all groups were infected with 3×10⁴ CFU of Vir LM i.v. LLO91−99 –stimulated CD8+ T cell were then analyzed at d67 post Att LM infection for IFN-γ expression by ICS in combination with staining for IL-2, CD27, the activation-associated glycoform of CD43, CD62L, and CD127. (A) Representative dot plots at d43+67 p.i. Numbers represent the percentage of CD8+ T cells that produce IFN-γ in the absence or presence of peptides. (B) Representative contour plots of IL-2 production by IFN-γ+ CD8+ T cells. Numbers represent the mean percentage +/-SD of IFN-γ+ CD8+ T cells staining positive for IL-2 or (isotype control). (C) Representative histograms of IFN-γ+ CD8+ T cells analyzed for CD27, CD43, CD62L, and CD127 expression (solid histograms) or isotype control staining (open histograms). Numbers represent the mean percentage +/-SD of IFN-γ+ CD8+ T cells staining positive for each phenotypic marker. CD8+ T cell responses were determined at day 6 post secondary challenge by ICS. Mean, +/− SD, total number of LLO91−99 –specific (D) and (E) p60217−225 –specific CD8+ T cells/spleen in mice at day 0 (open bars) and day 6 post Vir LM challenge. Data was pooled from 2 individual experiments (n = 3−6 mice / group). Dashed line indicates the LOD. (F) The mean number of bacteria per spleen was determined 2 days after Vir LM infection. Each symbol represents an individual mouse. Solid lines indicate the mean CFU/gram spleen. Data was pooled from 2 individual experiments (n = 3−6 mice / group). Dashed line indicates the limit of detection (LOD).
Figure 7
Figure 7
Phenotype and function of pre-existing LLO91−99 –specific memory CD8+ T cell in LCMV-infected mice. (A) Experimental design. BALB/c PKO and BALB/c WT mice were vaccinated with 3×10⁶ CFU of Att LM and infected with 2×10⁵ PFU of LCMV Arm i.p. 42 days later. LLO91−99 –specific memory CD8+ T cell were analyzed at day 73 post LCMV Arm infection for IFN-γ expression by ICS in combination with staining for IL-2, CD27, the activation-associated glycoform of CD43, CD62L, and CD127. (B) Representative contour plots of IFN-γ+ CD8+ T cells analyzed for IL-2 production. Numbers represent the mean percentage +/− SD of IL-2 producing IFN-γ+ CD8+ T cells or (isotype control). (C) Representative histograms of IFN-γ+ CD8+ T cells analyzed for expression of each phenotypic marker (solid histograms) or isotype control (open histograms). Numbers represent the mean percentage +/-SD of IFN-γ+ CD8+ T cells staining positive for each phenotypic marker. CD8+ T cell responses were determined at day 6 and 35 post secondary challenge by ICS. Mean, +/− SD, total number of (D) LLO91−99 –specific and (E) p60217−225 –specific CD8+ T cells/spleen in mice 1 day prior to Vir LM challenge (solid bars), at day 6 p.i. (open bars), and at day 35 p.i. (diagonally striped bars). Data is representative of duplicate experiments. n = 3 mice / time group. Dashed line indicates the limit of detection (LOD). (F) The mean number of bacteria per spleen was determined 2 days after Vir LM infection. Each symbol represents an individual mouse. Solid lines indicate the mean CFU/gram spleen (n = 3 mice / group). Dashed line indicates the limit of detection (LOD).

Similar articles

Cited by

References

    1. Ahmed R, Oldstone MB. Organ-specific selection of viral variants during chronic infection. J Exp Med. 1988;167(5):1719–24. - PMC - PubMed
    1. Almousa H, Ouachee-Chardin M, Picard C, Radford-Weiss I, Caillat-Zucman S, Cavazzana-Calvo M, Blanche S, de Saint Basile G, Le Deist F, Fischer A. Transient familial haemophagocytic lymphohistiocytosis reactivation post-CD34 haematopoietic stem cell transplantation. Br J Haematol. 2005;130(3):404–8. - PubMed
    1. Altman JD, Moss PA, Goulder PJ, Barouch DH, McHeyzer-Williams MG, Bell JI, McMichael AJ, Davis MM. Phenotypic analysis of antigen-specific T lymphocytes. Science. 1996;274(5284):94–6. - PubMed
    1. Badovinac VP, Hamilton SE, Harty JT. Viral infection results in massive CD8+ T cell expansion and mortality in vaccinated perforin-deficient mice. Immunity. 2003;18(4):463–74. - PubMed
    1. Badovinac VP, Porter BB, Harty JT. Programmed contraction of CD8(+) T cells after infection. Nat. Immunol. 2002;3(7):619–26. - PubMed

Publication types

MeSH terms

Substances