

The functional genome of CA1 and CA3 neurons under native conditions and in response to ischemia
- PMID: 17937787
- PMCID: PMC2194787
- DOI: 10.1186/1471-2164-8-370
The functional genome of CA1 and CA3 neurons under native conditions and in response to ischemia
Abstract
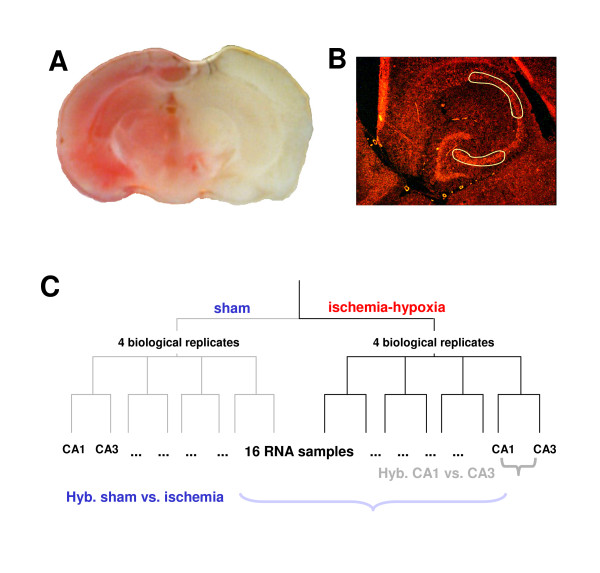
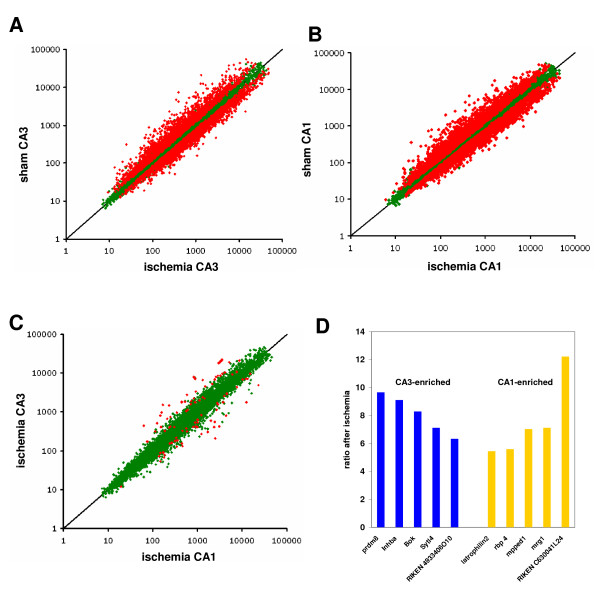
Background: The different physiological repertoire of CA3 and CA1 neurons in the hippocampus, as well as their differing behaviour after noxious stimuli are ultimately based upon differences in the expressed genome. We have compared CA3 and CA1 gene expression in the uninjured brain, and after cerebral ischemia using laser microdissection (LMD), RNA amplification, and array hybridization.
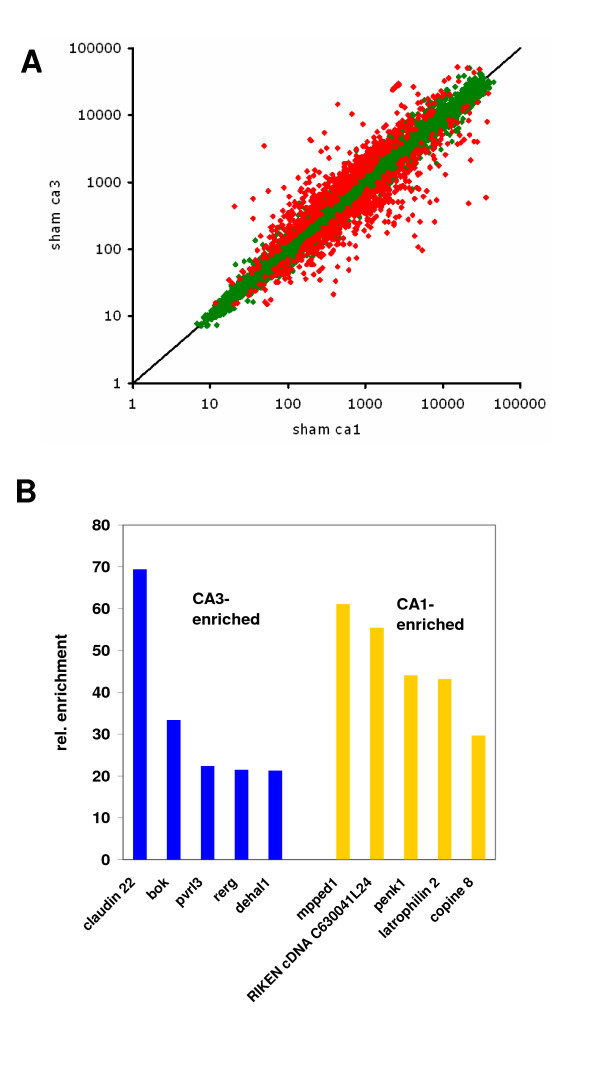
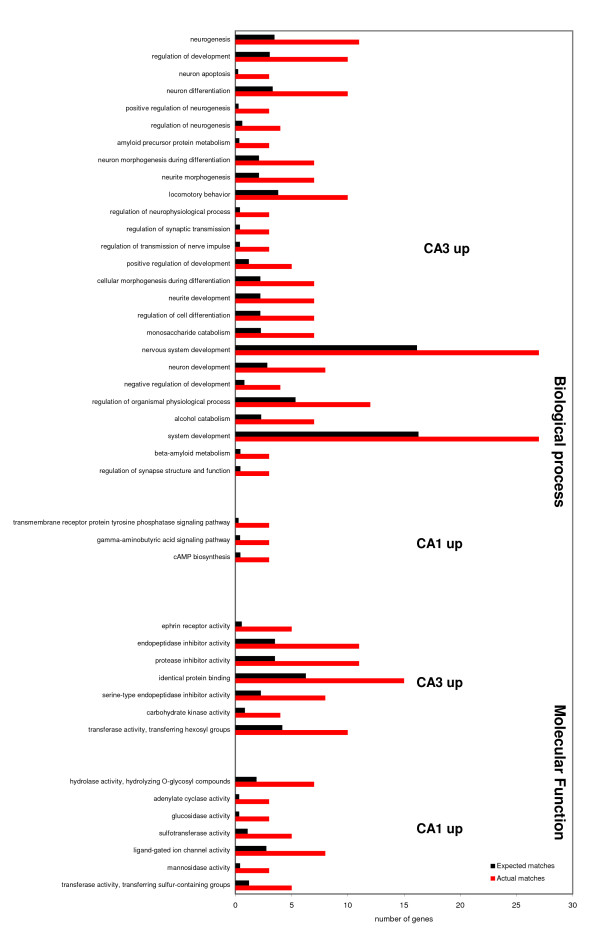
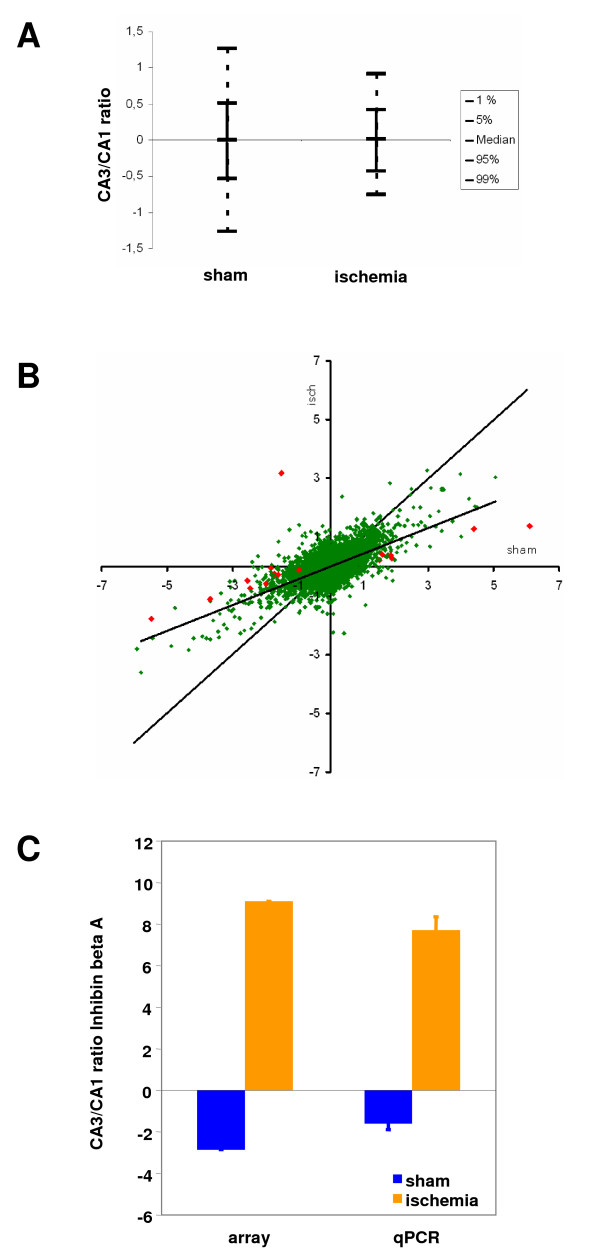
Results: Profiling in CA1 vs. CA3 under normoxic conditions detected more than 1000 differentially expressed genes that belong to different, physiologically relevant gene ontology groups in both cell types. The comparison of each region under normoxic and ischemic conditions revealed more than 5000 ischemia-regulated genes for each individual cell type. Surprisingly, there was a high co-regulation in both regions. In the ischemic state, only about 100 genes were found to be differentially expressed in CA3 and CA1. The majority of these genes were also different in the native state. A minority of interesting genes (e.g. inhibinbetaA) displayed divergent expression preference under native and ischemic conditions with partially opposing directions of regulation in both cell types.
Conclusion: The differences found in two morphologically very similar cell types situated next to each other in the CNS are large providing a rational basis for physiological differences. Unexpectedly, the genomic response to ischemia is highly similar in these two neuron types, leading to a substantial attenuation of functional genomic differences in these two cell types. Also, the majority of changes that exist in the ischemic state are not generated de novo by the ischemic stimulus, but are preexistant from the genomic repertoire in the native situation. This unexpected influence of a strong noxious stimulus on cell-specific gene expression differences can be explained by the activation of a cell-type independent conserved gene-expression program. Our data generate both novel insights into the relation of the quiescent and stimulus-induced transcriptome in different cells, and provide a large dataset to the research community, both for mapping purposes, as well as for physiological and pathophysiological research.
Figures
Similar articles
-
Differential expression of neurexin mRNA in CA1 and CA3 hippocampal neurons in response to ischemic insult.Brain Res Mol Brain Res. 2000 Dec 8;84(1-2):146-9. doi: 10.1016/s0169-328x(00)00237-0. Brain Res Mol Brain Res. 2000. PMID: 11113542
-
Transient expression of GAP-43 within the hippocampus after global brain ischemia in rat.Cell Tissue Res. 1997 May;288(2):225-38. doi: 10.1007/s004410050808. Cell Tissue Res. 1997. PMID: 9082958
-
Temporary changes of the AP-1 transcription factor binding activity in the gerbil hippocampus after transient global ischemia, and ischemic tolerance induction.Brain Res. 2000 Jul 28;872(1-2):282-93. doi: 10.1016/s0006-8993(00)02503-8. Brain Res. 2000. PMID: 10924710
-
Hippocampus as comparator: role of the two input and two output systems of the hippocampus in selection and registration of information.Hippocampus. 2001;11(5):578-98. doi: 10.1002/hipo.1073. Hippocampus. 2001. PMID: 11732710 Review.
-
Genomic approach to selective vulnerability of the hippocampus in brain ischemia-hypoxia.Neuroscience. 2015 Nov 19;309:259-79. doi: 10.1016/j.neuroscience.2015.08.034. Epub 2015 Sep 14. Neuroscience. 2015. PMID: 26383255 Review.
Cited by
-
The molecular mechanisms of cell death in the course of transient ischemia are differentiated in evolutionary distinguished brain structures.Metab Brain Dis. 2009 Sep;24(3):507-23. doi: 10.1007/s11011-009-9149-2. Epub 2009 Aug 20. Metab Brain Dis. 2009. PMID: 19693659
-
Expression of mRNA Encoding Mcu and Other Mitochondrial Calcium Regulatory Genes Depends on Cell Type, Neuronal Subtype, and Ca2+ Signaling.PLoS One. 2016 Feb 1;11(2):e0148164. doi: 10.1371/journal.pone.0148164. eCollection 2016. PLoS One. 2016. PMID: 26828201 Free PMC article.
-
A nanocleaner specifically penetrates the blood‒brain barrier at lesions to clean toxic proteins and regulate inflammation in Alzheimer's disease.Acta Pharm Sin B. 2021 Dec;11(12):4032-4044. doi: 10.1016/j.apsb.2021.04.022. Epub 2021 May 7. Acta Pharm Sin B. 2021. PMID: 35024324 Free PMC article.
-
STAIG: Spatial transcriptomics analysis via image-aided graph contrastive learning for domain exploration and alignment-free integration.Nat Commun. 2025 Jan 27;16(1):1067. doi: 10.1038/s41467-025-56276-0. Nat Commun. 2025. PMID: 39870633 Free PMC article.
-
Forced arm use is superior to voluntary training for motor recovery and brain plasticity after cortical ischemia in rats.Exp Transl Stroke Med. 2014 Feb 14;6(1):3. doi: 10.1186/2040-7378-6-3. Exp Transl Stroke Med. 2014. PMID: 24528872 Free PMC article.
References
-
- Visel A, Thaller C, Eichele G. GenePaint.org: an atlas of gene expression patterns in the mouse embryo. Nucleic Acids Res. 2004:D552–556. doi: 10.1093/nar/gkh029. - DOI - PMC - PubMed
-
- Gray PA, Fu H, Luo P, Zhao Q, Yu J, Ferrari A, Tenzen T, Yuk DI, Tsung EF, Cai Z, Alberta JA, Cheng LP, Liu Y, Stenman JM, Valerius MT, Billings N, Kim HA, Greenberg ME, McMahon AP, Rowitch DH, Stiles CD, Ma Q. Mouse brain organization revealed through direct genome-scale TF expression analysis. Science. 2004;306:2255–2257. doi: 10.1126/science.1104935. - DOI - PubMed
-
- Magdaleno S, Jensen P, Brumwell CL, Seal A, Lehman K, Asbury A, Cheung T, Cornelius T, Batten DM, Eden C, Norland SM, Rice DS, Dosooye N, Shakya S, Mehta P, Curran T. BGEM: an in situ hybridization database of gene expression in the embryonic and adult mouse nervous system. PLoS Biol. 2006;4:e86. doi: 10.1371/journal.pbio.0040086. - DOI - PMC - PubMed
Publication types
MeSH terms
LinkOut - more resources
Full Text Sources
Other Literature Sources
Miscellaneous
