. 2007 Oct 15:8:386.
doi: 10.1186/1471-2105-8-386.

Large scale statistical inference of signaling pathways from RNAi and microarray data

Affiliations

Large scale statistical inference of signaling pathways from RNAi and microarray data

Holger Froehlich et al. BMC Bioinformatics. .

Abstract

Background: The advent of RNA interference techniques enables the selective silencing of biologically interesting genes in an efficient way. In combination with DNA microarray technology this enables researchers to gain insights into signaling pathways by observing downstream effects of individual knock-downs on gene expression. These secondary effects can be used to computationally reverse engineer features of the upstream signaling pathway.

Results: In this paper we address this challenging problem by extending previous work by Markowetz et al., who proposed a statistical framework to score networks hypotheses in a Bayesian manner. Our extensions go in three directions: First, we introduce a way to omit the data discretization step needed in the original framework via a calculation based on p-values instead. Second, we show how prior assumptions on the network structure can be incorporated into the scoring scheme using regularization techniques. Third and most important, we propose methods to scale up the original approach, which is limited to around 5 genes, to large scale networks.

Conclusion: Comparisons of these methods on artificial data are conducted. Our proposed module network is employed to infer the signaling network between 13 genes in the ER-alpha pathway in human MCF-7 breast cancer cells. Using a bootstrapping approach this reconstruction can be found with good statistical stability. The code for the module network inference method is available in the latest version of the R-package nem, which can be obtained from the Bioconductor homepage.


Figures

Figure 1
Figure 1
Main idea of the inference framework by Markowetz et al.: A network hypothesis is a directed graph between S-genes. Attached to each S-gene are several E-genes. Knocking down S-gene S2 interrupts signal flow in the downstream pathway, and hence an effect of E-genes attached to S2 and to S1 is expected.
Figure 2
Figure 2
Scores of the top 25 models and the best model.
Figure 3
Figure 3
Sensitivity (top) and specificity (bottom) analysis for randomly generated networks with n = 4 S-genes: β = 100 (solid), β = 50 (dashed), β = 10 (dotted). Left: simulated annealing, right: module network.
Figure 4
Figure 4
Sensitivity (top) and specificity (bottom) analysis for randomly generated networks with n = 8 S-genes: β = 100 (solid), β = 50 (dashed), β = 10 (dotted). Left: simulated annealing, right: module network.
Figure 5
Figure 5
Sensitivity (top) and specificity (bottom) analysis for randomly generated networks with n = 12 S-genes: β = 100 (solid), β = 50 (dashed), β = 10 (dotted). Left: simulated annealing, right: module network.
Figure 6
Figure 6
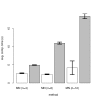
Computation times (s) for the module network (white) and the simulated annealing (gray) approach.
Figure 7
Figure 7
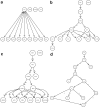
Interdepencencies of 13 genes in the ER-α pathway drawn as transitvely reduced graphs: a) literature knowledge (Ingenuity™), b) inferred without prior knowledge, c) inferred with prior knowledge on some E-gene – S-gene connections, d) inferred with additional knowledge from a). Figure b) – d) only show edges, which where found in more than 50% of all bootstrap sets. The corresponding fraction is reported at each edge.
Figure 8
Figure 8
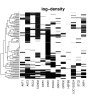
Heatmap showing the secondary effects of individual knock-downs (columns) on E-genes (rows) as log-f1 density (cutoff 0, darker = stronger effect). Our method tries to resolve the nested structure of these secondary effects.

References

    1. Boutros M, Agaisse H, Perrimon N. Sequential activation of signaling pathways during innate immune responses in Drosophila. Developmental Cell. 2002;3:711–722. doi: 10.1016/S1534-5807(02)00325-8. - DOI - PubMed
    1. Markowetz F, Bloch J, Spang R. Non-transcriptional pathway features reconstructed from secondary effects of RNA interference. Bioinformatics. 2005;21:4026–4032. doi: 10.1093/bioinformatics/bti662. - DOI - PubMed
    1. Tikhonov A, Arsenin V. Solutions of ill-posed problems. W.H. Winston; 1977.
    1. Smyth G. Linear models and empirical Bayes methods for assessing differential expression in microarray experiments. Statistical Applications in Genetics and Molecular Biology. 2004. p. 3. - PubMed
    1. Liao J, Lin Y, Selvanayagam Z, Shih W. A mixture model for estimating the local false discovery rate in DNA microarray analysis. Bioinformatics. 2004;20:2694–2701. doi: 10.1093/bioinformatics/bth310. - DOI - PubMed

Publication types

MeSH terms

LinkOut - more resources