

Utilization and spending trends for antiretroviral medications in the U.S. Medicaid program from 1991 to 2005
- PMID: 17937821
- PMCID: PMC2147021
- DOI: 10.1186/1742-6405-4-22
Utilization and spending trends for antiretroviral medications in the U.S. Medicaid program from 1991 to 2005
Abstract
Background: HIV/AIDS incidence and mortality rates have decreased in the U.S. since 1996. Accompanying the longer life spans of those diagnosed with the disease, however, is a tremendous rise in expenditures on medication. The objective of this study is to describe the trends in utilization of, spending on, and market shares of antiretroviral medications in the U.S. Medicaid Program. Antiretroviral drugs include nucleoside reverse transcriptase inhibitors (NRTIs), protease inhibitors (PIs), nonnucleoside reverse transcriptase inhibitors (NNRTIs), and fusion inhibitors (FIs).
Methods: Utilization and payment data from 1991 to 2005 are provided by the Centers for Medicare & Medicaid Services. Descriptive summary analyses were used to assess quarterly prescription numbers and amounts of payment.
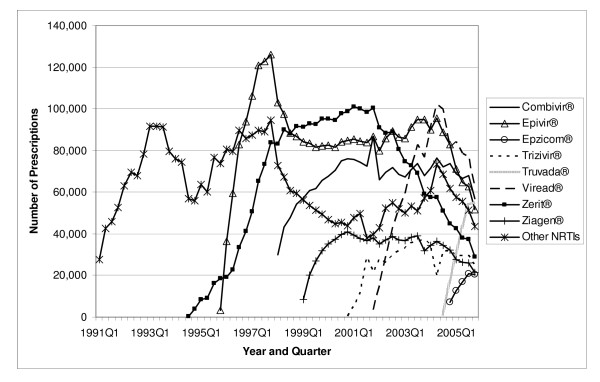
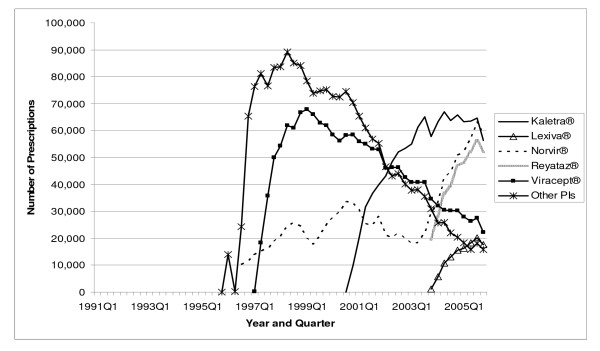
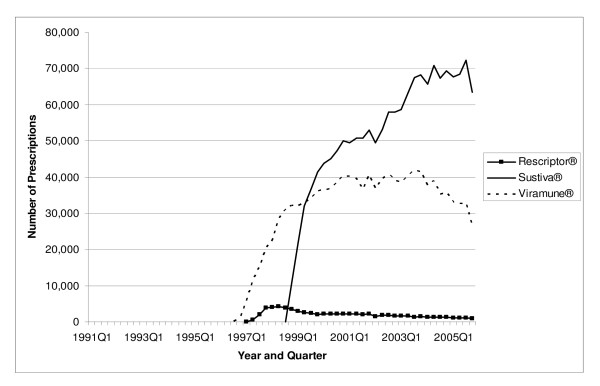
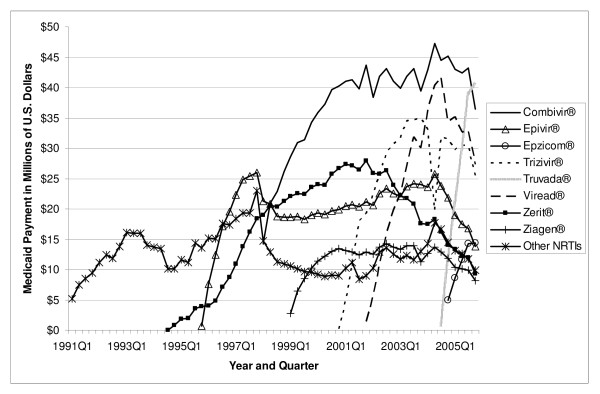
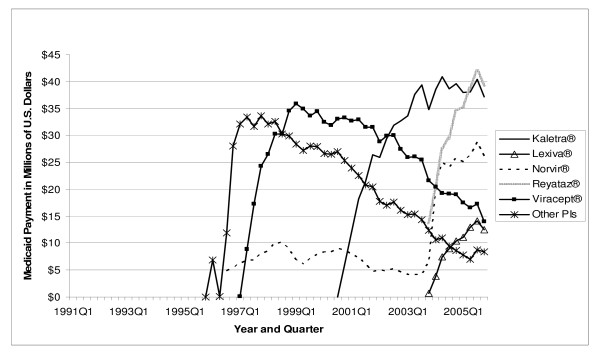
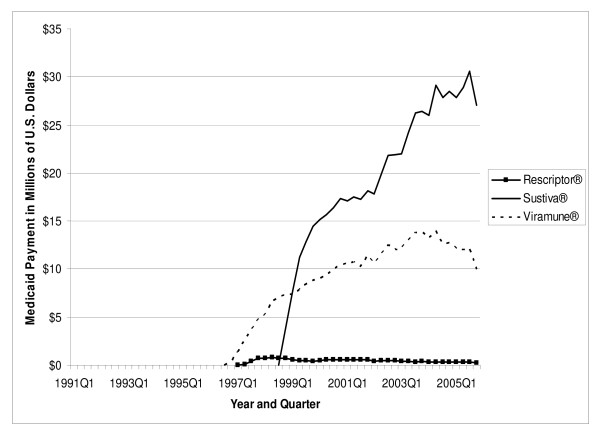
Results: The total number of prescriptions for antiretrovirals increased from 168,914 in 1991 to 2.0 million in 1998, and 3.0 million in 2005, a 16.7-fold increase over 15 years. The number of prescriptions for NRTIs reached 1.6 million in 2005. Prescriptions for PIs increased from 114 in 1995 to 932,176 in 2005, while the number of prescriptions for NNRTIs increased from 1,339 in 1996 to 401,272 in 2005. The total payment for antiretroviral drugs in the U.S. Medicaid Program increased from US$ 30.6 million in 1991 to US$ 1.6 billion in 2005, a 49.8-fold increase. In 2005, NRTIs as a class had the highest payment market share. These drugs alone accounted for US$ 787.9 million in Medicaid spending (50.8 percent of spending on antiretrovirals). Payment per prescription for each drug, with the exception of Agenerase, increased, at least somewhat, over time. The relatively expensive drugs in 2005 included Trizivir ($1040) and Combivir ($640), as well as Reyataz ($750), Lexiva ($700), Sustiva ($420), Viramune ($370), and Fuzeon ($1914).
Conclusion: The tremendous growth in antiretroviral spending is due primarily to rising utilization, secondarily to the entry of newer, more expensive antiretrovirals, and, finally, in part to rising per-prescription cost of existing medications.
Figures
References
-
- Centers for Disease Control and Prevention Pneumocystis pneumonia-Los Angeles. MMWR. 1981;30:250–252. - PubMed
-
- The Kaiser Family Foundation Fact sheet: the HIV/AIDS epidemic in the United States http://www.kff.org/hivaids/3029.cfm
-
- Centers for Disease Control and Prevention Epidemiology of HIV/AIDS-United States, 1981–2005. MMWR. 2006;55:589–592. - PubMed
-
- Centers for Disease Control and Prevention . HIV/AIDS surveillance report 2004. Atlanta, Georgia; 2005. http://www.cdc.gov/hiv/topics/surveillance/resources/reports/2004report/...
-
- Glynn MK, Rhodes P. Estimated HIV prevalence in the United States at the end of 2003. Presentation National HIV Prevention Conference. 2005.
LinkOut - more resources
Full Text Sources
