. 2007 Dec;27(24):8859-73.
doi: 10.1128/MCB.01724-07. Epub 2007 Oct 15.

HMGN1 modulates estrogen-mediated transcriptional activation through interactions with specific DNA-binding transcription factors

Affiliations

HMGN1 modulates estrogen-mediated transcriptional activation through interactions with specific DNA-binding transcription factors

Nan Zhu et al. Mol Cell Biol. 2007 Dec.

Abstract

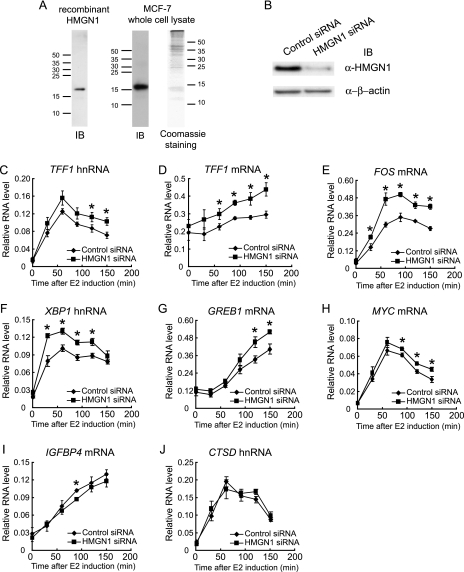
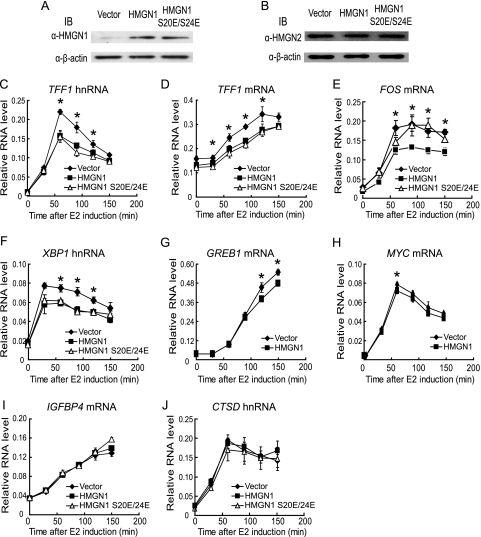
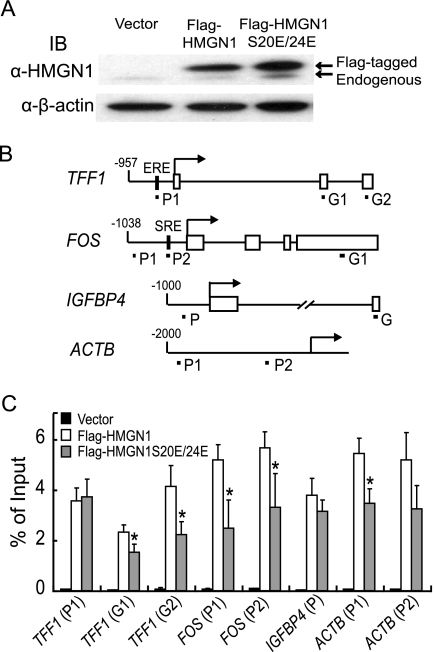
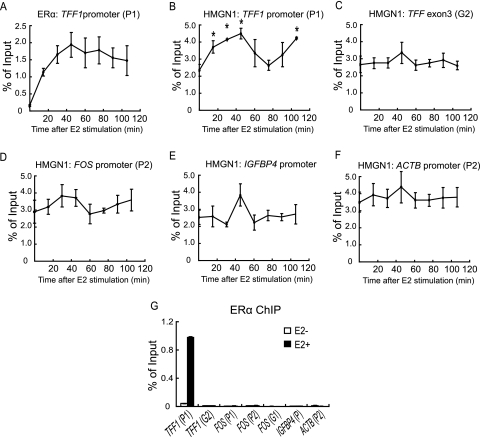
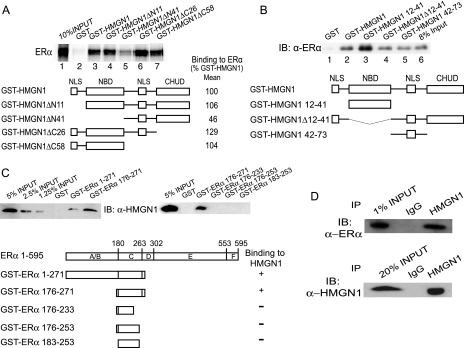
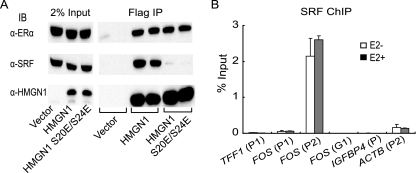
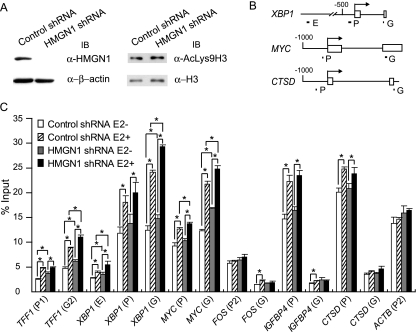
HMGN1, an abundant nucleosomal binding protein, can affect both the chromatin higher order structure and the modification of nucleosomal histones, but it alters the expression of only a subset of genes. We investigated specific gene targeting by HMGN1 in the context of estrogen induction of gene expression. Knockdown and overexpression experiments indicated that HMGN1 limits the induction of several estrogen-regulated genes, including TFF1 and FOS, which are induced by estrogen through entirely distinct mechanisms. HMGN1 specifically interacts with estrogen receptor alpha (ER alpha), both in vitro and in vivo. At the TFF1 promoter, estrogen increases HMGN1 association through recruitment by the ER alpha. HMGN1 S20E/S24E, although deficient in binding nucleosomal DNA, still interacts with ER alpha and, strikingly, still represses estrogen-driven activation of the TFF1 gene. On the FOS promoter, which lacks the ER alpha binding sites, constitutively bound serum response factor (SRF) mediates estrogen stimulation. HMGN1 also interacts specifically with SRF, but HMGN1 S20E/S24E does not. Consistent with the protein interactions, only wild-type HMGN1 significantly inhibits the estrogen-driven activation of the FOS gene. Mechanistically, the inhibition of estrogen induction of several ER alpha-associated genes, including TFF1, by HMGN1 correlates with decreased levels of acetylation of Lys9 on histone H3. Together, these findings indicate that HMGN1 regulates the expression of particular genes via specific protein-protein interactions with transcription factors at target gene regulatory regions.


Figures

FIG. 1.
FIG. 1.
Knockdown of HMGN1 levels in MCF-7 cells enhances estrogen-mediated transcription of several but not all genes. (A) Characterization of anti-HMGN1 antibodies. Either recombinant HMGN1 or MCF-7 whole-cell SDS lysate was resolved by SDS-PAGE and immunoblotted (IB) with a mixture of antibodies against HMGN1 N-terminal and C-terminal peptides. Coomassie blue staining of the MCF-7 whole-cell extract is also shown. Migrations of molecular weight markers are indicated by tick marks at the side of each gel. (B) Immunoblotting of whole-cell lysates of MCF-7 cells transfected either with siRNA against HMGN1 or with control siRNA. (Upper panel) Immunoblotting with antibodies against HMGN1 (α-HMGN1). (Lower panel) Immunoblotting with antibodies against β-actin. (C to J) MCF-7 cells were transfected either with siRNA against HMGN1 (filled squares) or control siRNA (filled diamonds). After transfection, cells were cultured under estrogen-deprived conditions. The time courses of induction of TFF1 hnRNA, TFF1 mRNA, FOS mRNA, XBP1 hnRNA, GREB1 mRNA, MYC mRNA, IGFBP4 mRNA, and CTSD hnRNA are indicated following the addition of 100 nM 17β-estradiol. RNA levels were analyzed as described in Materials and Methods; RNA levels from each gene are expressed relative to levels of 18S rRNA in the same sample. Representative data from three independent experiments are shown, with experiments performed in triplicate. Error bars indicate standard deviations. Asterisks indicate points that are statistically significant by a two-tailed t test, assuming unequal variance (P < 0.05) between control siRNA versus HMGN1 siRNA samples.
FIG. 2.
FIG. 2.
Overexpression of HMGN1 in MCF-7 cells represses estrogen-mediated transcription of several but not all genes. MCF-7 cells were transduced with retrovirus expressing the wild-type HMGN1, the HMGN1 S20E/S24E mutant, or the parental retroviral vector as a control. (A and B) Immunoblotting (IB) of whole-cell lysates of MCF-7 cells transduced with the indicated retroviruses. (Upper panel) Levels of HMGN1 (and HMGN1 S20E/S24E) (A) or HMGN2 (B) as monitored with antibodies against HMGN1 or HMGN2 (α-HMGN1 or α-HMGN2, respectively). (Lower panel) Levels of β-actin. (C to J) Transduced cells were deprived of estrogen and then subjected to 100 nM 17β-estradiol for up to 2.5 h. Time courses of induction of the indicated genes after stimulation are shown. Filled diamonds, RNA from control cells; filled squares, RNA from HMGN1-expressing cells; open triangles, RNA from HMGN1 S20E/S24E-expressing cells. Averages of data from experiments performed in triplicate are shown, which are representative of five independent experiments with HMGN1 and two independent experiments with HMGN1 S20E/S24E using MCF-7 cells transduced with different preparations of retroviruses. Error bars indicate standard deviations. Asterisks indicate points that are statistically significant by a two-tailed t test, assuming unequal variance (P < 0.05) between vector versus HMGN1 samples. Points that are statistically significant by t test between vector and HMGN1 S20E/24E samples are not shown on the graph, to prevent confusion, but include all the same time points as that between vector and HMGN1, plus the 30-min time point of XBP1 hnRNA.
FIG. 3.
FIG. 3.
The S20E/S24E mutations diminish the association of HMGN1 at most chromosomal locations but not at the TFF1 promoter. (A) Immunoblotting (IB) of whole-cell SDS lysates from MCF-7 cells transduced with control retrovirus (vector) or with retroviruses expressing either Flag-tagged HMGN1 or Flag-tagged HMGN1 S20E/S24E. (Upper panel) Endogenous and Flag-tagged HMGN1 (wild-type or S20E/S24E mutant), as indicated, were detected with antibodies against HMGN1 (α-HMGN1). (Lower panel) Immunoblotting with antibodies against β-actin. (B) Locations of the primers for various promoter (P) or gene coding regions (G). Transcription start sites are indicated by arrows, exons are shown as open boxes, and primers are shown as short lines. The scale for each diagram is proportional to the length in nucleotides. (C) ChIP assay comparing the binding of HMGN1 versus that of HMGN1 S20E/S24E to different chromosomal regions. MCF-7 cells were transduced with control retrovirus (vector), Flag-HMGN1-expressing virus (white bars), or Flag-HMGN1 S20E/S24E-expressing virus (gray bars). Exponentially growing cells were treated with formaldehyde and harvested, and chromatin was immunoprecipitated with anti-Flag antibody coupled to beads. Locations of the primers are indicated in panel B. The binding level of protein to the indicated promoter or gene coding region is expressed as the percentage of DNA immunoprecipitated compared to the total amount of chromosomal DNA before immunoprecipitation. Error bars represents standard deviations from triplicate samples. Asterisks indicate values that were statistically different, as calculated by a two-tailed t test assuming unequal variance (P < 0.05).
FIG. 4.
FIG. 4.
Association of HMGN1 with the TFF1 promoter increases upon estrogen induction. MCF-7 cells were cultured under estrogen-deprived conditions and then incubated with 17β-estradiol for up to 105 min. ChIP assays were performed using antibodies against either ERα (A and G) or HMGN1 (B to F). Input DNA and DNA isolated by the ChIP assays were quantified by real-time PCR. (A to F) The binding level of protein to the indicated promoter or gene coding region is expressed as indicated in the legend to Fig. 3C. Error bars represent standard errors of the means of three independent experiments. By analysis of variance, the association of HMGN1 only at the TFF1 promoter (P = 0.03) was statistically altered by the addition of estrogen. Pairwise t tests (two-tailed, assuming unequal variance) indicated the specific data points (indicated by asterisks) for which the level of HMGN1 binding was statistically different (P < 0.05) from that at the 0 time point. (G) Association of ERα to the indicated promoter or gene coding regions prior to (white bars) or after (black bars) a 45-min treatment with 17β-estradiol. The means from duplicate samples are shown; error bars represent standard deviations.
FIG. 5.
FIG. 5.
HMGN1 interacts with ERα both in vitro and in vivo. (A) GST pulldown assay between purified GST fusion proteins to wild-type or truncated HMGN1 and in vitro-translated 35S-labeled ERα (see Fig. S1 in the supplemental material for visualization of the GST fusion proteins). (Upper panel) Lanes 2 to 7, autoradiograph of the amount of ERα bound to the indicated GST fusion proteins; 1, amount of ERα in 10% of the input applied to each resin. (Lower panel) Schematic of the HMGN1 truncation proteins shown with the means of quantification of the data from two independent experiments; data are normalized to the amount of ERα binding to the wild-type HMGN1. (B) GST pulldown assay between purified GST fusion proteins to wild-type or truncated HMGN1 and purified recombinant ERα (see Fig. S1 in the supplemental material for visualization of the GST fusion proteins). (Upper panel) Lanes 1 to 5, immunoblot (IB) of the amount of ERα bound to the indicated GST fusion proteins; 6, amount of ERα in 8% of the input applied to each resin. α-ERα, anti-ERα antibody. (Lower panel) Schematic of the HMGN1 truncation proteins. (C) GST pulldown assay between GST fusion proteins to truncated ERα and MCF-7 cell extract (see Fig. S1 in the supplemental material for visualization of the GST fusion proteins). Bound proteins were immunoblotted for HMGN1. The leftmost three lanes and one lane in the left and right upper panels, respectively, contain the indicated percentages of the input extract that was used for each assay. The remaining lanes show the amounts of cellular HMGN1 bound to the indicated GST fusion proteins. (Lower panel) Schematic of the ERα truncations, along with a qualitative indication of whether the binding to HMGN1 was observed. Full-length ERα is drawn at the top, showing locations of domains A through F; domain C is the DNA-binding domain. (D) Coimmunoprecipitation assay between the endogenous HMGN1 and the endogenous ERα in MCF-7 cells. Cell lysate was immunoprecipitated with either anti-HMGN1 antibody or control immunoglobulin G. Immunoprecipitates were resolved by SDS-PAGE through either 8% or 15% gels, for the detection by immunoblotting of ERα (top panel) or HMGN1 (bottom panel), respectively. The leftmost lanes contained the indicated amounts of the extract used for the immunoprecipitation (IP).
FIG. 6.
FIG. 6.
S20E/S24E mutations in HMGN1 reduce specific interaction with SRF but not with ERα. (A) MCF-7 cells were transduced with control, parental retrovirus (vector), or retroviruses expressing either Flag-tagged HMGN1 or Flag-tagged HMGN1 S20E/S24E. TD buffer lysates were subjected to immunoprecipitation (IP) with anti-Flag M2 beads. Bound proteins were separated by SDS-PAGE before immunoblotting (IB) with antibodies against ERα (α-ERα) (upper panel), SRF (middle panel), or HMGN1 (bottom panel); the immunoprecipitations were performed in duplicate as indicated. In each case, the three lanes on the left contain 2% of the amount of input cell extracts used in the immunoprecipitation from each sets of transduced cells. (B) ChIP analysis for SRF binding to chromosomal sites in cells treated without (open bars) or with (dark gray bars) estrogen. MCF-7 cells were deprived of estrogen, and half were stimulated with 100 nM 17β-estradiol for 45 min. Both sets of cells were subjected to ChIP analysis with anti-SRF antibody. The binding level of the protein to the indicated promoter or gene region is expressed as indicated in the legend to Fig. 3C; the primers are shown in Fig. 3B. The means of duplicate samples are shown. Error bars represent standard deviations.
FIG. 7.
FIG. 7.
Loss of HMGN1 enhances the acetylation of histone H3 Lys9 at specific genes. (A) Immunoblotting (IB) of whole-cell lysates of a stable HMGN1 shRNA knockdown cell line or a control shRNA cell line (see Materials and Methods). (Upper left panel) Levels of HMGN1; (lower left panel) levels of β-actin; (upper right panel) levels of acetylated Lys9 H3; (lower right panel) levels of histone H3. α-HMGN1, anti-HMGN1 antibody. (B) Locations of the primers for various enhancer (E), promoter (P), or gene coding regions (G) are shown, as described in the legend to Fig. 3B. (C) ChIP assay of stable knockdown cell lines performed using anti-AcLys9H3 antibody. Similar results were observed for two independent HMGN1 stable knockdown cell lines; results from one comparison are shown here. The level of AcLys9H3 on the indicated enhancer, promoter, or gene region is expressed as indicated in the legend to Fig. 3C. The means of triplicate samples are shown. Error bars represent standard deviations. Asterisks show the values that are statistically significantly different by a two-tailed t test assuming unequal variance (P < 0.05) (values being compared are indicated by the brackets).

Similar articles

Cited by

References

    1. Abercrombie, B. D., G. G. Kneale, C. Crane-Robinson, E. M. Bradbury, G. H. Goodwin, J. M. Walker, and E. W. Johns. 1978. Studies on the conformational properties of the high-mobility-group chromosomal protein HMG 17 and its interaction with DNA. Eur. J. Biochem. 84:173-177. - PubMed
    1. Amano, T., K. Leu, K. Yoshizato, and Y. B. Shi. 2002. Thyroid hormone regulation of a transcriptional coactivator in Xenopus laevis: implication for a role in postembryonic tissue remodeling. Dev. Dyn. 223:526-535. - PubMed
    1. Augereau, P., F. Miralles, V. Cavailles, C. Gaudelet, M. Parker, and H. Rochefort. 1994. Characterization of the proximal estrogen-responsive element of human cathepsin D gene. Mol. Endocrinol. 8:693-703. - PubMed
    1. Begum, N., J. M. Pash, and J. S. Bhorjee. 1990. Expression and synthesis of high mobility group chromosomal proteins in different rat skeletal cell lines during myogenesis. J. Biol. Chem. 265:11936-11941. - PubMed
    1. Bertrand-Mercat, P., and J. R. Pasqualini. 1991. Antagonistic effect of the antiestrogen 4-hydroxytamoxifen on estradiol-stimulated acetylation of nuclear high mobility group (HMG) proteins in the uterus of newborn guinea pigs. Life Sci. 48:2081-2087. - PubMed

Publication types

MeSH terms

LinkOut - more resources