

Fibrotic response as a distinguishing feature of resistance and susceptibility to pulmonary infection with Mycobacterium tuberculosis in mice
- PMID: 17938213
- PMCID: PMC2223652
- DOI: 10.1128/IAI.00369-07
Fibrotic response as a distinguishing feature of resistance and susceptibility to pulmonary infection with Mycobacterium tuberculosis in mice
Abstract
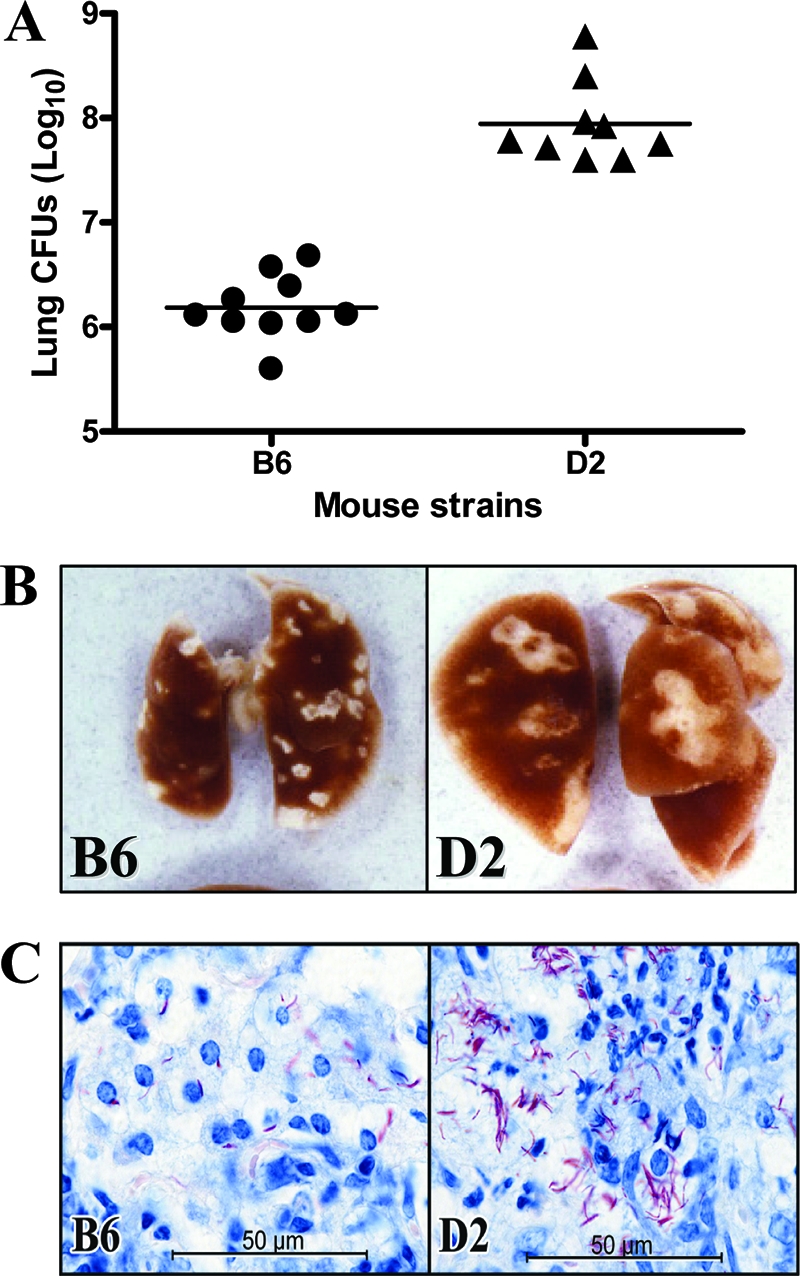
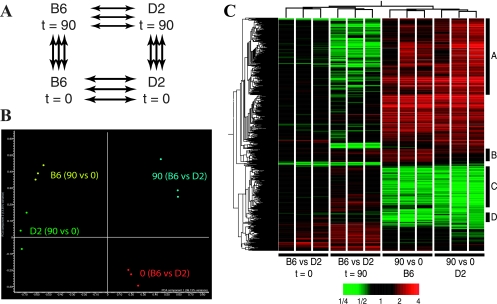
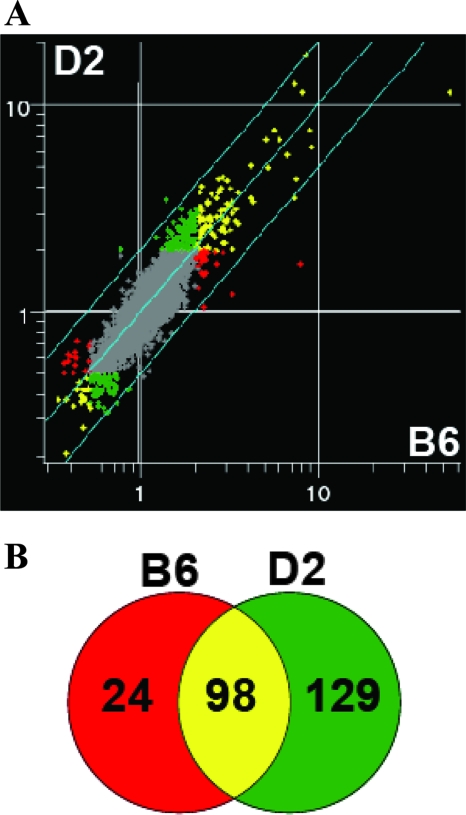
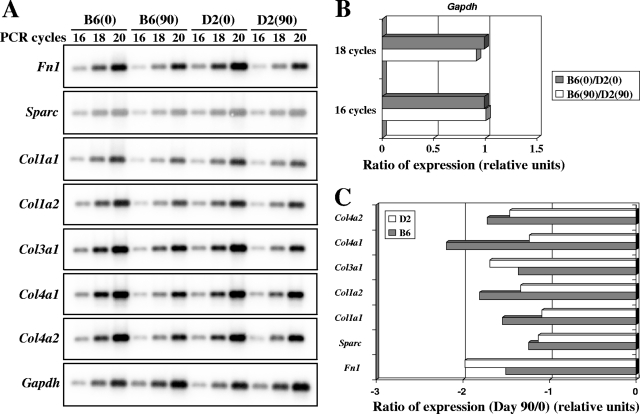
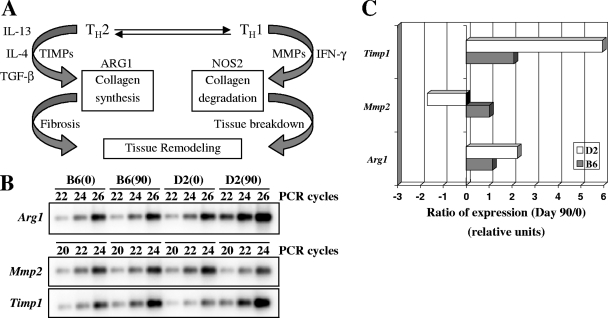
The differential susceptibility of inbred mouse strains DBA/2J (susceptible) and C57BL/6J (resistant) to pulmonary tuberculosis following aerosol infection is under complex genetic control. In this report, transcriptional profiling with RNAs from Mycobacterium tuberculosis-infected lungs was used to investigate the physiological response, cell type, and biochemical pathways underlying differential susceptibility to infection. Statistical analysis of cDNA-based microarrays revealed that 1,097 transcripts showed statistically significant changes in abundance (changes of > or = 1.5-fold) in at least one of four experimental group comparisons (C57BL/6J [day 0] versus DBA/2J [day 0] mice, C57BL/6J [day 90] versus DBA/2J [day 90] mice, C57BL/6J [day 90] versus C57BL/6J [day 0] mice, or DBA/2J [day 90] versus DBA/2J [day 0] mice). A group of genes showing very high degrees of significance (changes of > or = 2.0-fold) displayed enrichment for transcripts associated with tissue remodeling and the fibrotic response. The differential expression of fibrotic response genes (Sparc, Col1a1, Col1a2, Col4a1, and Col4a2) in the infected lungs of the two mouse strains was validated by another microarray platform (Affymetrix oligonucleotide chips) and by reverse transcription-PCR. Furthermore, the differential expression of additional genes known to be associated with fibrosis (Mmp2, Timp1, and Arg1) was also validated by these approaches. Overall, these results identify the differential fibrotic response as a pathological basis for the high susceptibility of DBA/2J mice to pulmonary tuberculosis.
Figures
Similar articles
-
Genetic control of susceptibility to infection with Mycobacterium tuberculosis in mice.Genes Immun. 2000 Dec;1(8):467-77. doi: 10.1038/sj.gene.6363712. Genes Immun. 2000. PMID: 11197687
-
Genetic and functional characterization of the mouse Trl3 locus in defense against tuberculosis.J Immunol. 2009 Mar 15;182(6):3757-67. doi: 10.4049/jimmunol.0802094. J Immunol. 2009. PMID: 19265154 Free PMC article.
-
Expression profiling identifies strain-specific changes associated with ethanol withdrawal in mice.Genes Brain Behav. 2002 Jan;1(1):35-45. doi: 10.1046/j.1601-1848.2001.00008.x. Genes Brain Behav. 2002. PMID: 12886948
-
Infection- and procedure-dependent effects on pulmonary gene expression in the early phase of influenza A virus infection in mice.BMC Microbiol. 2013 Dec 17;13:293. doi: 10.1186/1471-2180-13-293. BMC Microbiol. 2013. PMID: 24341411 Free PMC article.
-
Microarray analysis of retinal gene expression in the DBA/2J model of glaucoma.Invest Ophthalmol Vis Sci. 2006 Mar;47(3):977-85. doi: 10.1167/iovs.05-0865. Invest Ophthalmol Vis Sci. 2006. PMID: 16505032
Cited by
-
SPARC coordinates extracellular matrix remodeling and efficient recruitment to and migration of antigen-specific T cells in the brain following infection.Sci Rep. 2021 Feb 25;11(1):4549. doi: 10.1038/s41598-021-83952-0. Sci Rep. 2021. PMID: 33633185 Free PMC article.
-
Blockade of IL-10 signaling during bacillus Calmette-Guérin vaccination enhances and sustains Th1, Th17, and innate lymphoid IFN-γ and IL-17 responses and increases protection to Mycobacterium tuberculosis infection.J Immunol. 2012 Oct 15;189(8):4079-87. doi: 10.4049/jimmunol.1201061. Epub 2012 Sep 12. J Immunol. 2012. PMID: 22972927 Free PMC article.
-
Early control of Mycobacterium tuberculosis infection requires il12rb1 expression by rag1-dependent lineages.Infect Immun. 2012 Nov;80(11):3828-41. doi: 10.1128/IAI.00426-12. Epub 2012 Aug 20. Infect Immun. 2012. PMID: 22907814 Free PMC article.
-
Cell-mediated immune responses in tuberculosis.Annu Rev Immunol. 2009;27:393-422. doi: 10.1146/annurev.immunol.021908.132703. Annu Rev Immunol. 2009. PMID: 19302046 Free PMC article. Review.
-
Immunohistological characterization of spinal TB granulomas from HIV-negative and -positive patients.Tuberculosis (Edinb). 2013 Jul;93(4):432-41. doi: 10.1016/j.tube.2013.02.009. Epub 2013 Mar 28. Tuberculosis (Edinb). 2013. PMID: 23541388 Free PMC article.
References
-
- Casanova, J. L., and L. Abel. 2002. Genetic dissection of immunity to mycobacteria: the human model. Annu. Rev. Immunol. 20581-620. - PubMed
-
- Cataldo, D., C. Munaut, A. Noel, F. Frankenne, P. Bartsch, J. M. Foidart, and R. Louis. 2000. MMP-2- and MMP-9-linked gelatinolytic activity in the sputum from patients with asthma and chronic obstructive pulmonary disease. Int. Arch. Allergy Immunol. 123259-267. - PubMed
-
- Chackerian, A. A., and S. M. Behar. 2003. Susceptibility to Mycobacterium tuberculosis: lessons from inbred strains of mice. Tuberculosis (Edinburgh) 83279-285. - PubMed
-
- Chua, F., J. Gauldie, and G. J. Laurent. 2005. Pulmonary fibrosis: searching for model answers. Am. J. Respir. Cell. Mol. Biol. 339-13. - PubMed
Publication types
MeSH terms
Grants and funding
LinkOut - more resources
Full Text Sources
Other Literature Sources
Research Materials
Miscellaneous
