. 2007 Nov;130(5):465-78.
doi: 10.1085/jgp.200709843. Epub 2007 Oct 15.

A quantitative description of KcsA gating I: macroscopic currents

Affiliations

A quantitative description of KcsA gating I: macroscopic currents

Sudha Chakrapani et al. J Gen Physiol. 2007 Nov.

Abstract

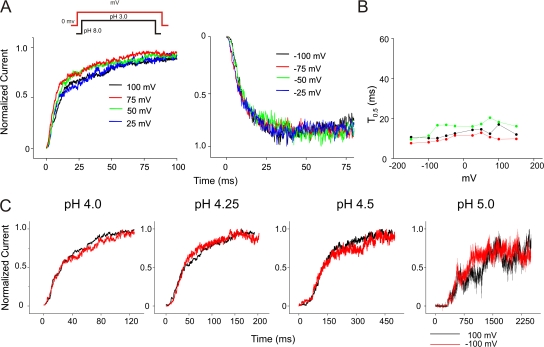
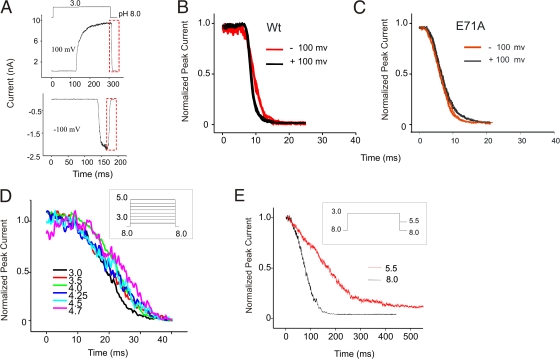
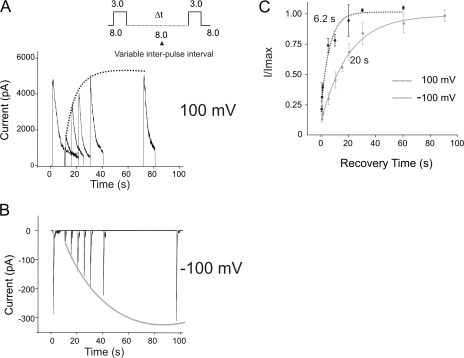
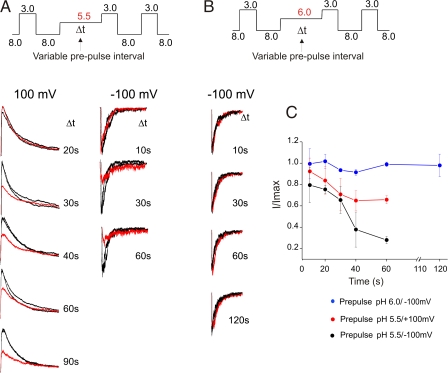
The prokaryotic K(+) channel KcsA is activated by intracellular protons and its gating is modulated by transmembrane voltage. Typically, KcsA functions have been studied under steady-state conditions, using macroscopic Rb(+)-flux experiments and single-channel current measurements. These studies have provided limited insights into the gating kinetics of KcsA due to its low open probability, uncertainties in the number of channels in the patch, and a very strong intrinsic kinetic variability. In this work, we have carried out a detailed analysis of KcsA gating under nonstationary conditions by examining the influence of pH and voltage on the activation, deactivation, and slow-inactivation gating events. We find that activation and deactivation gating of KcsA are predominantly modulated by pH without a significant effect of voltage. Activation gating showed sigmoidal pH dependence with a pKa of approximately 4.2 and a Hill coefficient of approximately 2. In the sustained presence of proton, KcsA undergoes a time-dependent decay of conductance. This inactivation process is pH independent but is modulated by voltage and the nature of permeant ion. Recovery from inactivation occurs via deactivation and also appears to be voltage dependent. We further find that inactivation in KcsA is not entirely a property of the open-conducting channel but can also occur from partially "activated" closed states. The time course of onset and recovery of the inactivation process from these pre-open closed states appears to be different from the open-state inactivation, suggesting the presence of multiple inactivated states with diverse kinetic pathways. This information has been analyzed together with a detailed study of KcsA single-channel behavior (in the accompanying paper) in the framework of a kinetic model. Taken together our data constitutes the first quantitative description of KcsA gating.


Figures

Figure 1.
Figure 1.
Macroscopic behavior of KcsA in a pH jump experiment. Upon reconstitution in asolectin liposomes, KcsA is predominantly oriented with its C terminus inside the vesicle. In an inside-out patch, KcsA is activated by pH jumps from 8.0 to 3.0 using a rapid solution exchanger. The channels are seen to activate in ∼15 ms and in the sustained presence of protons inactivate with a time constant of 1–3 s.
Figure 2.
Figure 2.
pH-dependent activation of KcsA. (A) Macroscopic activation of KcsA by pH jump. The duration of the pulse was chosen so as to elicit maximal activation and to close the channels before the currents begin to decay due to inactivation. (B) Representative macroscopic current traces elicited in response to jumps of pH from 8.0 to the indicated value. Currents were recorded under symmetrical 200 mM K+ at a holding membrane potential of +100 mV. (C) An expanded view of the first 25 ms of the activation time course. Foot of the sigmoidal macroscopic activation (Boxed area) is evident at relatively more basic pH (4.0–4.5) (D) Time required for the current to reach half its maximal value (T0.5) was measured and plotted as a function of pH and fitted with the Hill equation. (Inset) A plot of normalized T0.5 (measured for six different patches). The pKa of activation and nH was found to be 4.37 ± 0.03 and 2.11 ± 0.33, respectively. (E) Peak amplitude, which is a reflection of the open probability, vs. pH fitted with the Hill equation. (Inset) Normalized peak amplitudes plotted for 10 patches, pKa (4.22 ± 0.02) and nH (1.9 ± 0.2).
Figure 3.
Figure 3.
Effect of voltage on KcsA activation. (A) Overlap of normalized current traces recorded in response to jumps of pH from 8.0 to 3.0 at depolarizing (left) and hyperpolarizing (right) membrane potentials. (B) The time required for half maximal activation (T0.5) plotted against voltage from three datasets. Activation rates at negative potentials are marginally faster (approximately two times) than at positive membrane potentials. (C) Macroscopic activation of E71A elicited by jumps from pH 8.0 to indicated pH. Traces in black and red were recorded at depolarizing and hyperpolarizing potentials, respectively. Currents were normalized to their peak amplitudes. This result shows that there is no change in the activation time constants at positive and negative potentials when inactivation is removed.
Figure 4.
Figure 4.
Effect of voltage on the inactivation gating. (A) Macroscopic currents elicited in response to pH jump from 8.0 to 3.0 and recorded at various membrane potentials. (B) The time constant of inactivation, measured by fitting a single exponential to the decay phase of the macroscopic, was plotted as a function of voltage. KcsA inactivates faster when the membrane is held at hyperpolarizing potentials. (Inset) Shows normalized time constants from three patches.
Figure 5.
Figure 5.
Effect of pH on the inactivation gating. (A) Currents were evoked in response to different pH in the presence of 200 mM K+ symmetrical. The lengths of the pH pulse protocol were chosen such that in each case the currents decayed to their steady-state value. The membrane potential was held at +100 mV (left). The decay phases of the macroscopic currents were overlapped upon normalizing to their peak amplitude. The time constant of inactivation was estimated by monoexponential fits to the current decay and plotted against pH (middle). Since there was considerable variability in the inactivation rates among patches, for each experiment the values measured at different pH were normalized to that measured at pH 3.0. Plots show measurements from nine patches (right). Currents were recorded in the presence of (B) 5 mM K+ external/200 mM K+ internal and (C) 200 mM Rb+ symmetrical. When compared with symmetrical K+, the rates of inactivation increased significantly when the external K+ was lowered and dramatically decreased when Rb+ was the permeant ion (note the difference in time scale). Normalized time constants are from eight and three patches for 5 mM K+ external/200 mM K+ internal and 200 mM Rb+ symmetrical, respectively. Under any of these conditions, pH did not significantly affect the inactivation rates.
Figure 6.
Figure 6.
Effect of voltage and pH on deactivation. (A) Deactivation or channel closing was elicited by jumps to pH 3.0 from pH 8.0. Duration of the activating pulse was chosen such as to evoke maximal channel activation and to terminate before currents appear to decay due to inactivation. (B) Overlap of deactivation measured from four pH pulses at +100 (black) and −100 mV (red) holding potentials. The channel closing at −100 mV was marginally slower than +100 mV. (C) Deactivation kinetics of E71A at both positive and negative potentials was similar. (D) Channels were deactivated by pH 8.0 following activation by different pH pulses. The plot shows an overlap of decay phases of the current normalized to their peak amplitude. The macroscopic channel closing rate is independent of the pH that evoked activation. (E) Deactivation is much slower and biexponential when channel closing is brought about by pH 5.5 compared with pH 8.0.
Figure 7.
Figure 7.
Recovery from inactivation. Currents were elicited by a double pH pulse protocol with a variable interpulse duration at pH 8.0 to monitor the recovery time course of KcsA. The membrane was held at either +100 mV (A) or −100 mV (B). The amplitude of the current in response to the second pulse starts to increase progressively as the interpulse increases above 500 ms. (C) Fractional recovery, as measured by (I/I max), from four patches was plotted as a function of the interpulse interval and fitted to a single exponential. Recovery of KcsA from inactivation is modulated by voltage and occurs approximately threefold faster at +100 mV than at −100 mV.
Figure 8.
Figure 8.
Closed-state inactivation in KcsA. (A) Inactivation of KcsA from closed states before channel opening was evaluated by measuring currents in response to varying duration of prepulses of intermediate pH (5.5) at positive (left) and negative membrane potentials (right). Currents evoked by flanking pulses of pH 3.0 are shown in black, while the response of the prepulse is shown in red. The amplitude of the peak current progressively decreases as the duration of the prepulse increases. This decrease is attributed to channels inactivating from the partly activated closed states. (B) The above protocol is repeated with prepulses of pH 6.0. There is no visible loss of channels during prepulses of pH 6.0 (C) The amplitude of the peak current after a prepulse is normalized by the peak current value of the first and the third pulse, I/Imax is plotted as a function of the duration of the prepulse from four patches.
Figure 9.
Figure 9.
Effect of ion permeation on inactivation. (A) KcsA was activated by a 10-s pulse of pH 3.0 at −100 mV under symmetrical K+ (200 mM). The channels rapidly open and eventually inactivate as shown by red trace. The group of black traces represents conditions in which the voltage pulse is applied with an indicated delay after the pH pulse. During the delay, the channels are fully open but do not conduct due to a lack of the electrochemical driving force. Under these conditions the channels are still seen to inactivate although the time course appears to be slower than when accompanied by ion permeation (red trace). (B) The time course of inactivation with (red) and without ion permeation (black). Inset shows data from three patches.
Figure 10.
Figure 10.
Recovery of channels from an inactivation process that occurs without ion conduction. (A) The fractional recovery of KcsA was measured with a two-pulse protocol with an interpulse duration (pH 8.0) of 5 s at +100 mV (left) and −100 mV (right). (B) To measure recovery of channel from inactivation that occurs without ion conduction, the channels were opened by a jump to pH 3.0 but maintained at 0 mV. This was followed by an interpulse duration of 5 s. The fraction of channels that recovered during this interval was measured from the amplitude of the second pulse of pH 3.0 at +100 mV (left) or −100 mV (right). The extent of recovery is larger when the channels inactivate without ion conduction. (C) To evaluate if channels were indeed inactivated in the pulse of pH 3.0 at 0 mV, the voltage was changed to +100 mV at the end of the pH pulse. The amplitude of the current corresponded to that of the steady-state value of the first test pulse, which clearly shows that most of the channels were inactivated.

Similar articles

Cited by

References

    1. Armstrong, C.M. 2003. Voltage-gated K channels. Sci. STKE. 2003:re10. - PubMed
    1. Armstrong, C.M., and A. Loboda. 2001. A model for 4-aminopyridine action on K channels: similarities to tetraethylammonium ion action. Biophys. J. 81:895–904. - PMC - PubMed
    1. Ayer, R.K., Jr., and F.J. Sigworth. 1997. Enhanced closed-state inactivation in a mutant Shaker K+ channel. J. Membr. Biol. 157:215–230. - PubMed
    1. Baukrowitz, T., and G. Yellen. 1995. Modulation of K+ current by frequency and external [K+]: a tale of two inactivation mechanisms. Neuron. 15:951–960. - PubMed
    1. Bezanilla, F. 2000. The voltage sensor in voltage-dependent ion channels. Physiol. Rev. 80:555–592. - PubMed

Publication types