. 2007 Nov;130(5):479-96.
doi: 10.1085/jgp.200709844. Epub 2007 Oct 15.

A quantitative description of KcsA gating II: single-channel currents

Affiliations

A quantitative description of KcsA gating II: single-channel currents

Sudha Chakrapani et al. J Gen Physiol. 2007 Nov.

Abstract

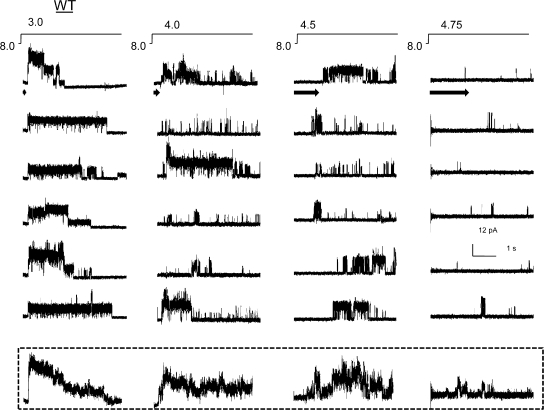
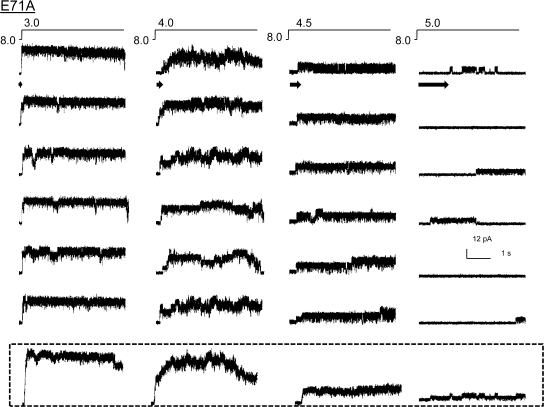
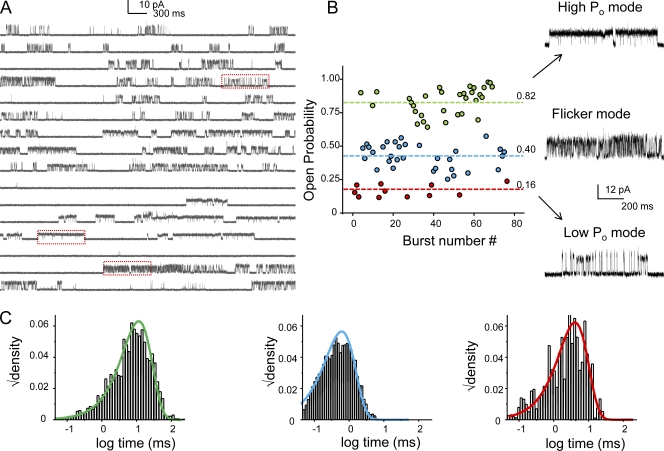
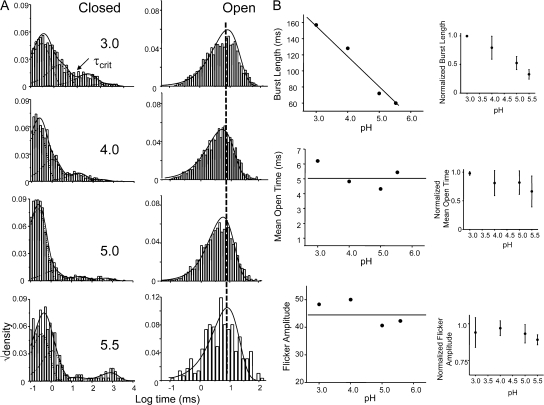
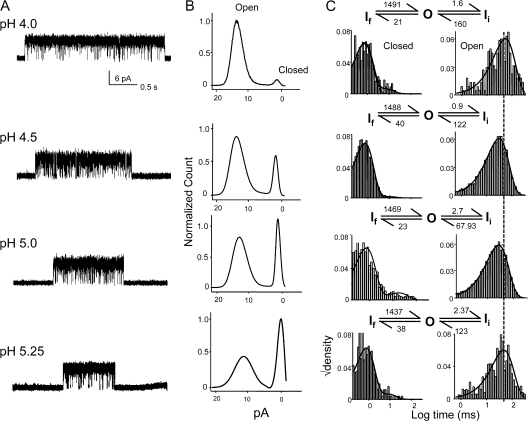
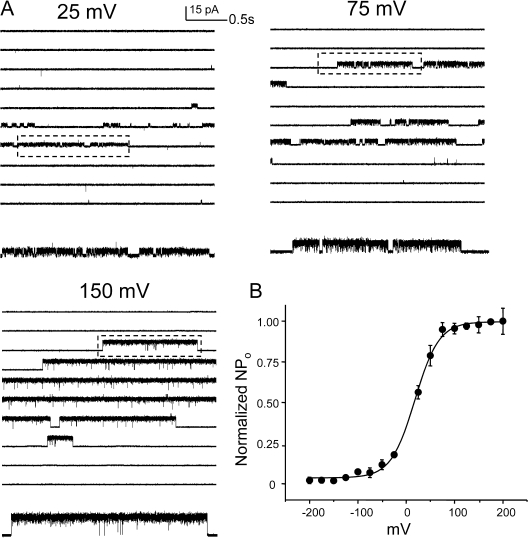
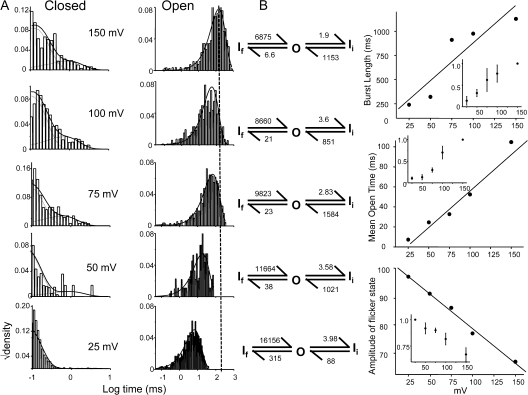
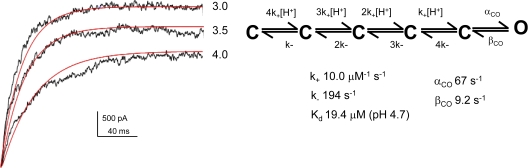
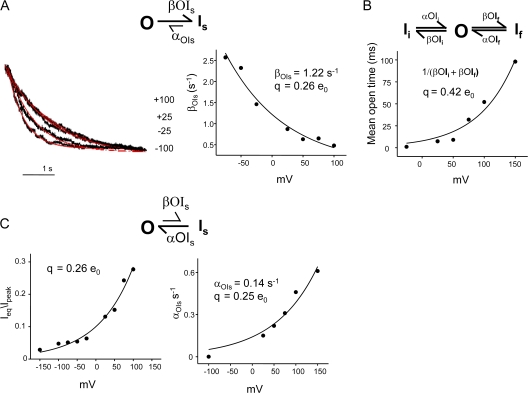
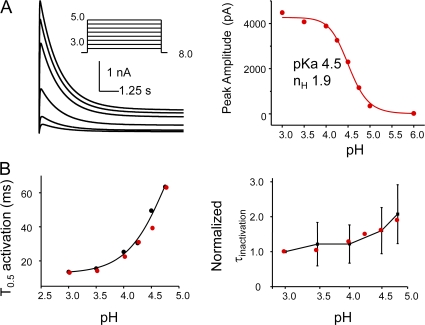
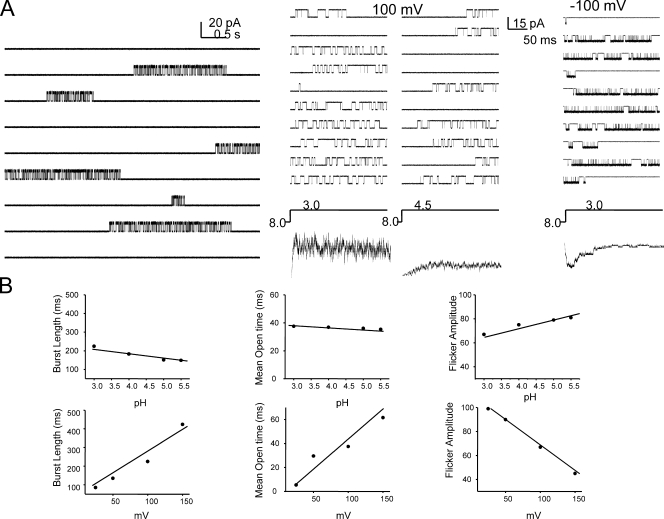
The kinetic transitions of proton-activated WT KcsA and the noninactivating E71A mutant were studied at the single-channel level in purified, liposome-reconstituted preparations. Single-channel currents were recorded using patch-clamp techniques under nonstationary and steady-state conditions. Maximum-likelihood analyses reveal that the key influence of acidic pH is to increase the frequency of bursting without an effect on the intraburst open and closed dwell times, consistent with the finding from macroscopic currents that protons promote activation without a significant effect on inactivation. However, in steady-conditions of pH, voltage not only alters the burst frequency but also affects their properties, such as the frequency of the flickers and the dwell times of the closed and open states. This is to be expected if voltage modulates pathways connecting open and inactivated states. Upon opening, KcsA can enter at least two closed states that are not part of the activation pathway. The frequency and duration of these closed states was found to be voltage dependent and therefore these are likely to represent short-lived inactivated states. Single-channel recordings of WT KcsA also show varying propensity for the presence of subconductance states. The probability of occurrence of these states did not show clear modulation by voltage or pH and their origin remains unclear and a focus for further investigation. A kinetic model is proposed to describe the gating events in KcsA that recapitulates its macroscopic and single-channel behavior. The model has been constrained by the single-channel analyses presented in this work along with data from macroscopic currents in the preceding paper.


Figures

Figure 1.
Figure 1.
Ensemble average of WT single-channel activity. Inside-out patches from liposomes containing KcsA in a low protein:lipid ratio (1:10,000 mass:mass). Representative openings elicited in response to jumps of indicated pH at +100 mV (top). The arrow marks the delay to first opening. The peak amplitude of current at pH 3.0 reveals approximately three to five channels in the patch. Ensemble averages of single-channel currents from 10 pulses of pH (bottom).
Figure 2.
Figure 2.
Ensemble average of E71A single-channel activity. Single-channel behavior of E71A, a mutant that removes inactivation, in response to pH jumps (top). Ensemble averages of 10 different pH pulses.
Figure 3.
Figure 3.
Modal behavior of KcsA. (A) A continuous single-channel recording of KcsA under steady-state conditions at pH 3.0 (maximal activation) with membrane potential at +100 mV. (B) KcsA displays a highly variable kinetic behavior that arises from a combination of three distinct modes of channels activity, the low Po, high Po, and the flickery mode. Boxed areas are shown in expanded time scale on the right. The frequency of occurrence of these modes is random and varies from patch to patch. This particular recording was chosen for illustration purpose only to highlight the occurrence of all the three modes. From the distribution of the modes within the trace it can be seen that for this patch the flicker and the high Po modes seem to be more prevalent, although the occurrence of the flicker mode is rare in most of the patches. (C) The lifetime of the open state within the modes is described by single exponentials.
Figure 4.
Figure 4.
pH-dependent modulation of single-channel behavior of KcsA under steady-state conditions. (A) Representative traces of single-channel currents recorded within the same patch under different pH conditions. Boxed areas denoting burst activity are shown below at higher resolution. Currents were sampled at 40 kHz and low-pass filtered at 5 kHz. (B) The NPo normalized to the value at pH 3.0 (for three patches) plotted against pH and fitted with the Hill equation yields a pKa of 4.37 ± 0.03 and nH = 1.51 ± 0.06.
Figure 5.
Figure 5.
pH increases the frequency of channel activity without an effect on the burst behavior. (A) Closed and open interval dwell-time distributions for the entire record and the smooth line corresponds to the density functions calculated from the optimal fit using a four closed and one open state model. (B) Kinetic analysis after extracting bursts of channel activity by using a critical time (τcrit). The “burst” consisted of the open state and the two shortest closed states, which most likely comes from a single-channel activity. (Inset) Normalized values for six patches.
Figure 6.
Figure 6.
Burst properties of E71A are not modulated by pH. (A) Representative single-channel traces displaying burst activity at various pH. (B) Amplitude histogram for the entire record shows the effect of pH in decreasing the lifetime of the closed state without an effect on the conductance of the open state. (C) Distribution of open and closed interval within bursts isolated using τcrit. The superimposed density functions were calculated by fits to model shown above the histogram. The rate constants are s−1.
Figure 7.
Figure 7.
Steady-state behavior of WT KcsA is modulated by voltage. (A) Single-channel currents recorded at pH 3.0 under different membrane potentials. Boxed regions are shown in high resolution below. (B) A plot of NPopen vs. voltage (from five patches) shows the modulation of steady-state open probability by voltage.
Figure 8.
Figure 8.
Voltage modulates the frequency and the behavior of bursts. (A) Dwell time distribution of closed and open events within bursts identified using τcrit. Idealization and analysis of the burst were done at full bandwidth (40 kHz acquisition and 5 kHz filter) using SKM in the QuB suite. The solid line denotes the density function calculated by fitting to two closed and one open state model. (B) The properties of the burst as a function of voltage. (Inset) Normalized values for three patches.
Figure 9.
Figure 9.
Global fitting of macroscopic current responses using maximum likelihood-based method to estimate the rate constant in the activation pathway. The rising phase of the macroscopic activation recorded at pH 3.0, 3.5, and 4.0 was simultaneously fit to the scheme (right) to get a direct estimate for the on and off rate for proton binding and the channel opening and closing rate constants. The scheme was constrained to assume that proton binding to all the subunits is equal and independent.
Figure 10.
Figure 10.
Estimation of the rate constants and their voltage dependencies in the inactivation pathway. (A) The decay time courses of the macroscopic currents elicited by jumps to pH 3.0 at different membrane potentials were fit to Scheme 1. The βOIs estimated from the scheme was plotted as a function of voltage and fit using the equation β(V) = β(0)e qv/kT, yielding βOIs (0) = 1.22 s−1 and q = 0.26 e0. (B) To estimate the voltage dependency of the two short-lived closed states within the burst, the mean open time derived from single-channel analysis was fitted as an exponential function of voltage, which yields a partial charge of q = 0.42 e0. (C) Steady-state recovery from inactivation was estimated from the macroscopic records as ratio of steady-state current to its peak value (left). Steady-state recovery is also reflected in the lifetime of the longest closed state in the single-channel currents under equilibrium conditions (right). Both measurements reveal a partial charge of q = 0. 25 e0 with this conformational change.
Figure 11.
Figure 11.
Model-based simulation of macroscopic currents. (A) Simulation of macroscopic currents in response to pH jumps using Scheme 1. Dose–response curves fitted with Hill equation yields a pKa of 4.5 and the Hill coefficient 2. (B) pH dependence of the half-maximal activation and inactivation time constants. The black and red circles represent the experimental and simulated values, respectively.
Figure 12.
Figure 12.
Model-based simulation of single-channel currents. (A) Stationary (left) and nonstationary (right) properties of single- channel currents based on Scheme 1. (B) Kinetic properties of the burst at various conditions of pH and membrane voltage.

Similar articles

Cited by

References

    1. Aldrich, R.W., and C.F. Stevens. 1983. Inactivation of open and closed sodium channels determined separately. Cold Spring Harb. Symp. Quant. Biol. 48:147–153. - PubMed
    1. Aldrich, R.W., D.P. Corey, and C.F. Stevens. 1983. A reinterpretation of mammalian sodium channel gating based on single channel recording. Nature. 306:436–441. - PubMed
    1. Armstrong, C.M., and W.F. Gilly. 1979. Fast and slow steps in the activation of sodium channels. J. Gen. Physiol. 74:691–711. - PMC - PubMed
    1. Auerbach, A., and C.J. Lingle. 1986. Heterogeneous kinetic properties of acetylcholine receptor channels in Xenopus myocytes. J. Physiol. 378:119–140. - PMC - PubMed
    1. Ball, F.G., and M.S. Sansom. 1989. Ion-channel gating mechanisms: model identification and parameter estimation from single channel recordings. Proc. R. Soc. Lond. B. Biol. Sci. 236:385–416. - PubMed

Publication types