. 2007 Nov;130(5):497-511.
doi: 10.1085/jgp.200709869. Epub 2007 Oct 15.

Tarantula toxins interact with voltage sensors within lipid membranes

Affiliations

Tarantula toxins interact with voltage sensors within lipid membranes

Mirela Milescu et al. J Gen Physiol. 2007 Nov.

Abstract

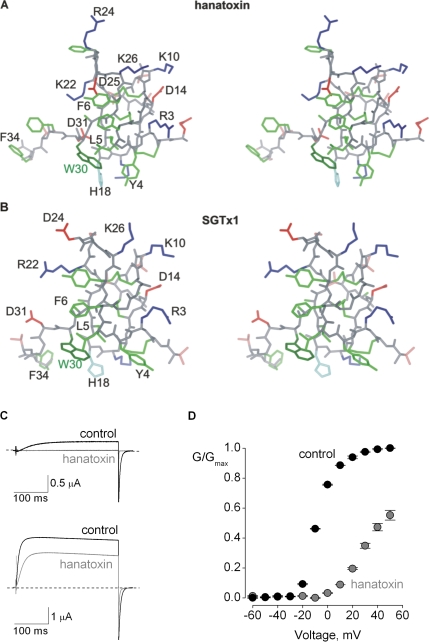
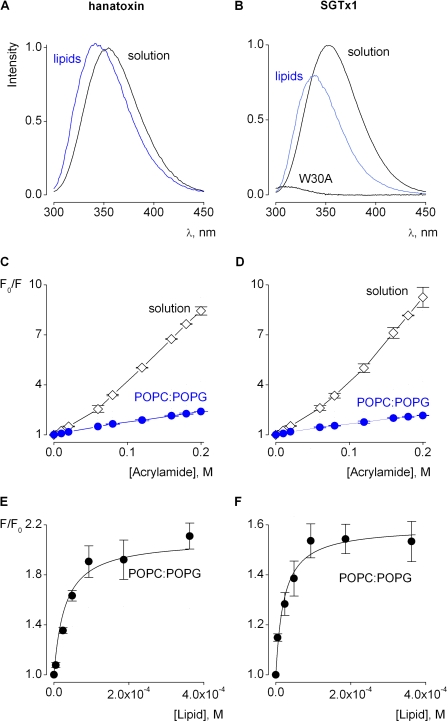
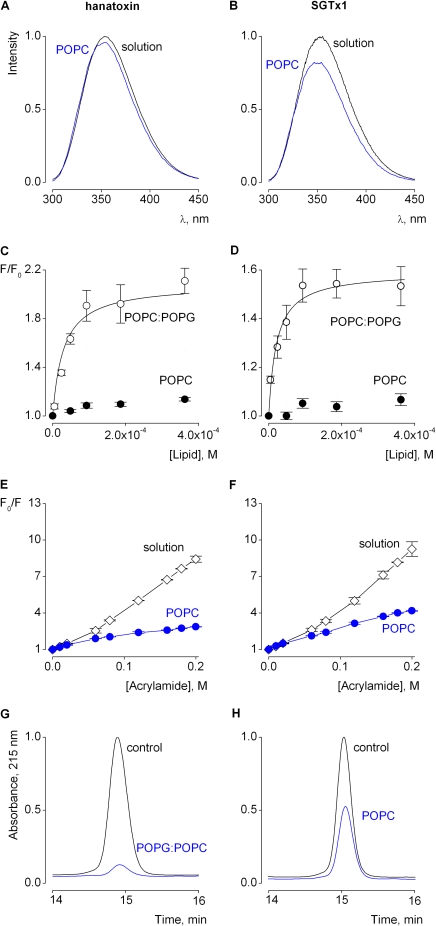
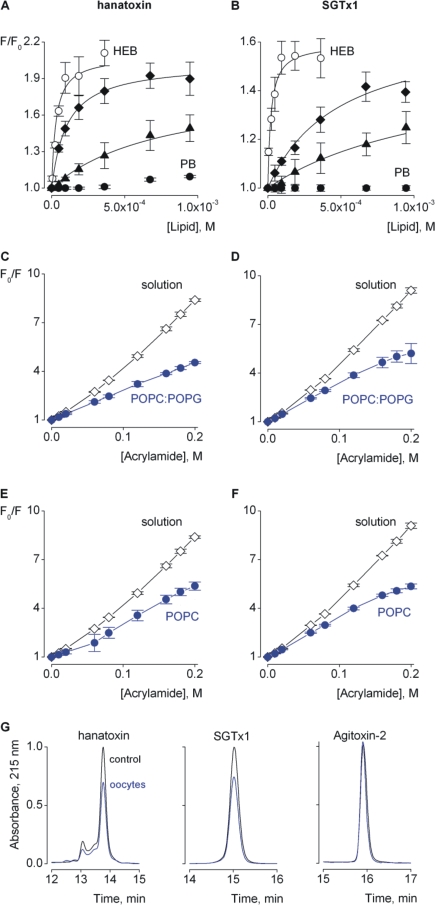
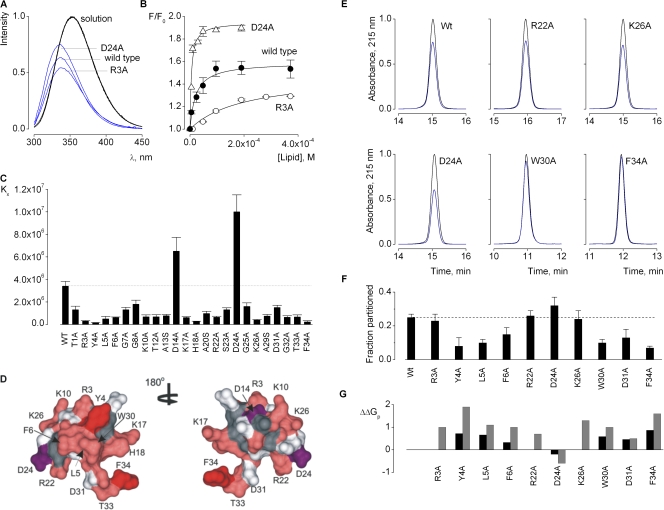
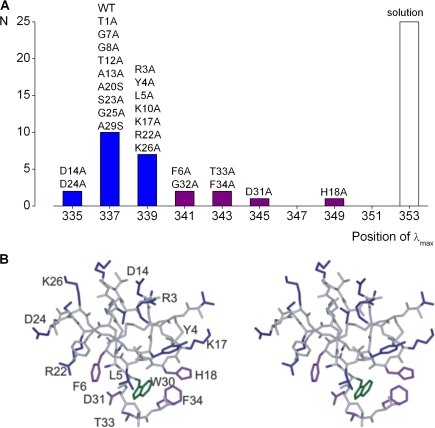
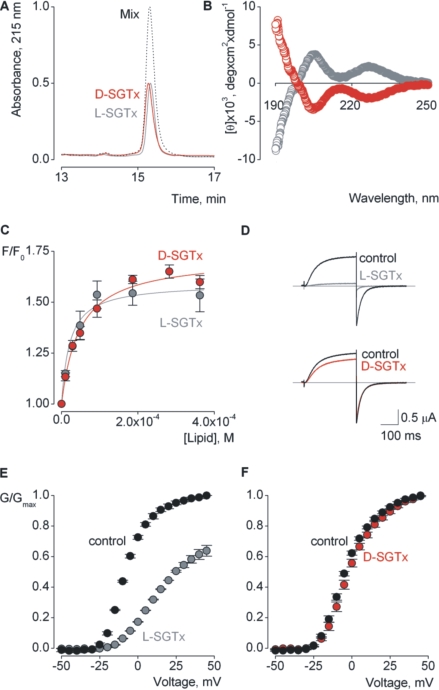
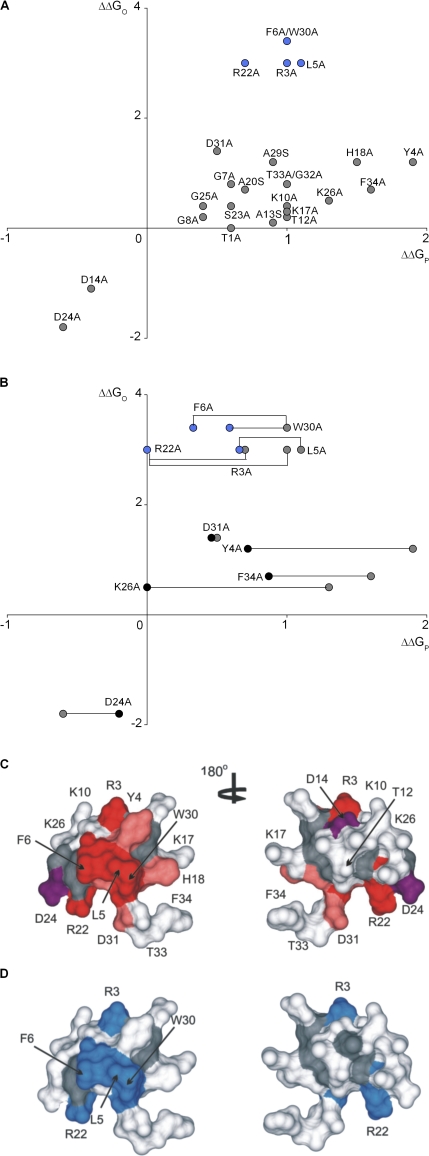
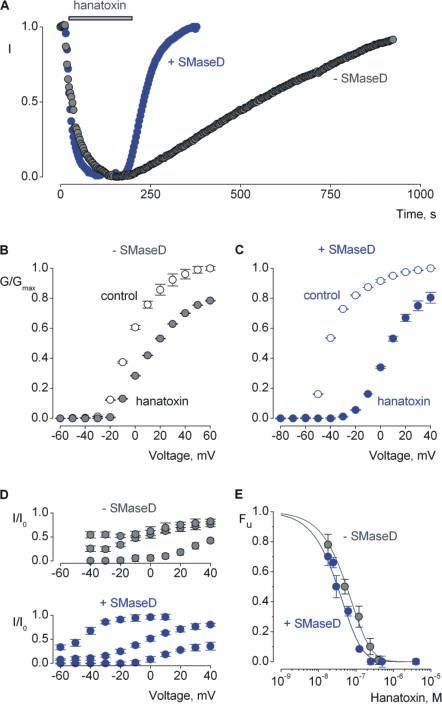
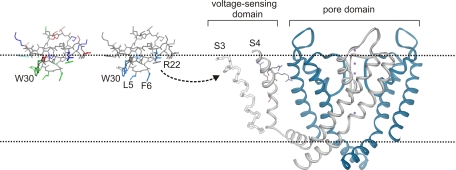
Voltage-activated ion channels are essential for electrical signaling, yet the mechanism of voltage sensing remains under intense investigation. The voltage-sensor paddle is a crucial structural motif in voltage-activated potassium (K(v)) channels that has been proposed to move at the protein-lipid interface in response to changes in membrane voltage. Here we explore whether tarantula toxins like hanatoxin and SGTx1 inhibit K(v) channels by interacting with paddle motifs within the membrane. We find that these toxins can partition into membranes under physiologically relevant conditions, but that the toxin-membrane interaction is not sufficient to inhibit K(v) channels. From mutagenesis studies we identify regions of the toxin involved in binding to the paddle motif, and those important for interacting with membranes. Modification of membranes with sphingomyelinase D dramatically alters the stability of the toxin-channel complex, suggesting that tarantula toxins interact with paddle motifs within the membrane and that they are sensitive detectors of lipid-channel interactions.


Figures

Figure 1.
Figure 1.
NMR structures of hanatoxin and SGTx1 and inhibition of the Kv2.1 channel by hanatoxin. Stereo views of hanatoxin (A) and SGTx1 (B) NMR solution structures. Side chain colors are as follows: green, hydrophobic; blue, basic; red, acidic; pink, Ser/Thr; gray, other side chains and backbone atoms. Protein database accession codes are 1D1H for hanatoxin and 1LA4 for SGTx1. (C) Voltage-clamp recording from an oocyte expressing the Kv2.1 channel. Currents were elicited by depolarization to −10 mV (above) or +50 mV (below), in the absence (black) or presence of 4 μM hanatoxin (gray). The holding voltage was −100 mV, and the tail voltage was −80 mV. The dashed line indicates the level of zero current. Leak, background, and capacitive currents were subtracted after blocking the channel with agitoxin-2. (D) Voltage– activation relations in the absence (black) and presence of 4 μM hanatoxin (gray). Tail currents obtained following depolarizations were averaged for 0.2 ms beginning 2 ms after repolarization to −80 mV. Data points are the mean ± SEM (n = 3).
Figure 2.
Figure 2.
Interaction of hanatoxin and SGTx1 with lipid vesicles. Fluorescence emission spectra of hanatoxin (A) and SGTx1 (B) in the absence (black) or presence of lipid vesicles composed of a 1:1 mix of POPC:POPG (blue). The lipid concentration was 2.4 mM. Spectrum of W30A mutant of SGTx1 in solution is shown for comparison. Stern-Volmer plots for acrylamide quenching of W30 fluorescence of hanatoxin (C) and SGTx1 (D) in solution (2 μM, black diamonds) and in the presence of lipid vesicles (0.9 mM, blue circles). Fluorescence intensity at 320 nm plotted as a function of available lipid concentration (60% of total lipids) for hanatoxin (E) or SGTx1 (F). Smooth curves correspond to partition functions with Kx = (4.8 ± 0.4) × 106 and F/F0 max = 2.0 ± 0.05 for hanatoxin and Kx = (3.4 ± 0.6) × 106 and F/F0 max = 1.6 ± 0.05 for SGTx1. All data were obtained using HEB solution (10 mM HEPES, 1 mM EDTA, pH 7). In all cases data points are the mean ± SEM (n = 3).
Figure 3.
Figure 3.
Effect of lipid composition on partitioning of hanatoxin and SGTx1 into lipid membranes. Fluorescence emission spectra of hanatoxin (A) and SGTx1 (B) in the absence (black) or presence of lipid vesicles composed POPC (blue). The lipid concentration was 2.4 mM. Fluorescence intensity at 320 nm plotted as a function of available lipid concentration (solid symbols) for hanatoxin (C) and SGTx1 (D). Data for vesicles containing a 1:1 mix of POPC:POPG (open symbols and smooth curves, same as in Fig. 2, E and F) is shown for comparison. Stern-Volmer plots for acrylamide quenching of W30 fluorescence of hanatoxin (E) and SGTx1 (F) in solution (2 μM, black diamonds) and in the presence of POPC vesicles (0.9 mM, blue circles). Data points are the mean ± SEM (n = 3). (G and H) Reversed-phase HPLC profiles of SGTx1 present in the supernatant after ultracentrifugation in the absence (black) or after addition of 9 mM lipid vesicles (blue). Traces were normalized to the maximum in the absence of lipid vesicles. All data were obtained using HEB solution (10 mM HEPES, 1 mM EDTA, pH 7).
Figure 4.
Figure 4.
Effects of solution composition on partitioning of hanatoxin and SGTx1 into lipid membranes. Fluorescence intensity at 320 nm plotted as a function of available anionic lipid concentration for hanatoxin (A) and SGTx1 (B). Smooth curves are the fits of a partition function to the data as follows: diamonds for 100 mM KCl data: Kx = (5.3 ± 0.03) × 105 and F/F0 max = 2.0 ± 0.02 for hanatoxin, and Kx = (1.1 ± 0.001) × 105 and F/F0 max = 1.7 ± 0.03 for SGTx1; triangles for 100 mM K+, 1 mM free Ca2+ data: Kx = (4.8 ± 0.01) × 104 and F/F0 max = 2.1 ± 0.1 for hanatoxin, and Kx = (1.9 ± 0.01) × 104 and F/F0 max = 2.0 ± 0.5 for SGTx1; closed circles for 100 mM K+, 1 mM Ca2+, 0.3 mM Mg2+, pH 7.6 (PB). Data from Fig 2 (E and F) for HEB solution are shown for comparison using open circles. Stern-Volmer plots for acrylamide quenching of W30 fluorescence of hanatoxin (C and E) and SGTx1 (D and F) in physiological buffer (PB) (2 μM, black diamonds) and in the presence of either anionic (C and D) or neutral (E and F) lipid vesicles (0.9 mM, blue circles). In all cases data points are the mean ± SEM (n = 3). (G) Reversed-phase HPLC profiles of hanatoxin, SGTx, and agitoxin-2 present in the supernatant in the absence (black) or in the presence of 300 oocytes (blue) resuspended in physiological buffer (PB). The calculated fraction partitioned (fP = ([Toxintotal] − [Toxinfree])/[Toxintotal]) is 0.31 ± 0.05 for hanatoxin, 0.25 ± 0.04 for SGTx1, and 0.01 ± 0.01 for agitoxin-2. Data are the mean ± SEM (n = 3). Traces were normalized to the maximum absorbance in the absence of oocytes.
Figure 5.
Figure 5.
Effect of SGTx1 mutations on partitioning into membranes. (A) Toxins fluorescence spectra in the absence (black) or presence of anionic lipid vesicles (blue). The lipid concentration was 0.4 mM. (B) Fluorescence intensity at 320 nm for WT, D24A, and R3A plotted as a function of available lipid concentration (60%). Data points are the mean ± SEM (n = 3). Smooth curves are fits of a partition function to the data with the following parameters: Kx = (1.0 ± 0.03) × 107 and F/F0 max = 2.0 ± 0.02 for D24A (open triangles), and Kx = (7.0 + 0.1) × 105 and F/F0 max = 1.4 ± 0.03 for R3A (open circles). Data for WT SGTx is shown for comparison (solid circles, same as in Fig. 2 F). (C) Kx values for partitioning of WT and mutant SGTx1 into anionic lipids. (D) Perturbations in partitioning into anionic membranes mapped onto the SGTx1 NMR solution structure, shown as a surface rendering with a probe radius of 1 Å. Side-chain colors are as follows: light gray for |ΔΔGP| < 1 kcal/mol, pink for |ΔΔGP| = 1–1.5 kcal/mol, red for |ΔΔGP| > 1.5 kcal/mol, and purple for ΔΔGP < −1 kcal/mol. Backbone and all other residues are colored dark gray. Structure in the right panel was rotated 180° about the indicated axis. Changes in free energy were calculated as: ΔΔGP = −RTln(Kx mut/Kx WT). The change in Kx value for W30A relative to WT (ΔΔGP ∼1 kcal mol−1) was estimated from depletion experiments. (E) Reversed-phase HPLC profiles of WT and mutant SGTx1 toxins present in the supernatant in the absence (black) or in the presence of 300 X. laevis oocytes (blue). Traces were normalized to the maximum in the absence of oocytes. (F) Fraction of toxin partitioned into oocytes membranes. Data are the mean ± SEM (n = 3). The dotted line corresponds to the value for wild type SGTx1. (G) Comparison between the effect of mutations on partitioning into model (gray, same as in C and D) and native membranes (black).
Figure 6.
Figure 6.
Spectral characteristics of SGTx1 peptides. (A) λmax for WT and SGTx1 mutants free in solution (open bar) or in the presence of 2.4 mM anionic liposomes (blue for λmax values within 2 nm of that observed for WT and purple for all others). (B) Spectral characteristics of membrane-bound toxins mapped onto the NMR solution structure of SGTx1. Side-chain colors for the stereo pairs are as follows: blue for WT-like spectra, purple for red-shifted maxima, and green for W30. All other side chains and backbone are gray.
Figure 7.
Figure 7.
Comparison of the biochemical and functional behavior of SGTx1 enantiomers. (A) Reversed-phase HPLC profiles of L-SGTx (gray) and D-SGTx (red) injected either separately or together (dotted black trace). (B) Circular dichroism spectra of L-SGTx (gray symbols) and D-SGTx (red symbols). (C) Fluorescence intensity at 320 nm plotted as a function of available lipid concentration (60%) for a 1:1 mix of POPC: POPG. Smooth red curve is the fit to the D-SGTx data and corresponds to a partition function with Kx = (1.2 ± 0.2) × 106 and F/F0 max = 1.7 ± 0.03. Data for L-SGTx is shown for comparison (gray, same as in Fig. 2 F). (D) Voltage-clamp recording from an oocyte expressing the Kv2.1 channel. Currents were elicited by depolarization to −10 mV in the absence (black) or presence of 8 μM L-SGTx1 (gray) or 8 μM D-SGTx1 (red). The holding voltage was −100 mV, and the tail voltage was −50 mV. The light gray line indicates the level of zero current. Leak, background, and capacitive currents were subtracted after blocking the channel with agitoxin-2. Voltage–activation relations in the absence (black) and presence of 8 μM L-SGTx1 (gray) (E) or 8 μM D-SGTx1 (red) (F). Tail currents obtained following depolarizations were averaged for 0.2 ms beginning 2 ms after repolarization to −50 mV. In all case data points are the mean ± SEM (n = 3).
Figure 8.
Figure 8.
Comparison of the effects of SGTx1 mutations on membrane partitioning and apparent affinity. (A) Perturbations in toxin partitioning into model membranes (ΔΔGP) from Fig. 5, C and D, plotted against changes in apparent toxin affinity for Kv2.1 channels (ΔΔGO). Blue symbols indicate the values for residues proposed to be involved in direct toxin–channel interactions. ΔΔGO = −RTln(Kd mut/Kd WT), where Kd is the apparent equilibrium dissociation constant determined from experiments in which aqueous toxin concentration is varied and the resulting fraction of unbound channels measured when activating the channel using weak depolarizations (Swartz and MacKinnon, 1997a). Apparent Kd values are from Wang et al. (2004). (B) Perturbations in toxin partitioning into native membranes (ΔΔGP) from Fig. 5 G plotted against changes in apparent toxin affinity for Kv2.1 channels (ΔΔGO). Data from A is shown for comparison (gray). (C) Perturbations in apparent Kd mapped onto the SGTx1 NMR solution structure, shown as a surface rendering with a probe radius of 1 Å. Side-chain colors are as follows: light gray for |ΔΔGO| < 1 kcal/mol, pink for |ΔΔGO| = 1–1.5 kcal/mol, red for |ΔΔGO| > 1.5 kcal/mol, and purple for ΔΔGO < −1 kcal/mol. Backbone and all other residues are colored dark gray (Wang et al., 2004). (D) Residues proposed to participate in direct toxin–channel interaction are colored blue, all other residues studied are colored white, backbone and unstudied residues are colored dark gray. In the right panels the structures were rotated 180° about the indicated axis.
Figure 9.
Figure 9.
Effect of sphingomyelinase D on inhibition of Kv2.1 channels by hanatoxin. (A) Time course for effects of hanatoxin (500 nM) on the Kv2.1 channel before (gray) and after 15 min treatment of oocytes with SMaseD (blue). I is tail current amplitude at −80 mV elicited following depolarizations to −10 mV for control (gray) or −50 mV after SMaseD treatment (blue), normalized to the value in the absence of toxin. Voltage–activation relations for Kv2.1 before (B) or after SMaseD treatment (C) in the absence (open symbols) or presence (solid symbols) of 100 nM hanatoxin. Tail currents obtained following depolarizations were averaged for 0.2 ms beginning 2 ms after repolarization to −80 mV. (D) Fraction of uninhibited current plotted against test voltage at three hanatoxin concentrations (50 nM, 100 nM, 4 μM) for untreated (top, gray) and SMaseD-treated (bottom, blue) oocytes. (E) Concentration dependence for inhibition of Kv2.1 channel. Fu, the fraction of unbound channels, was estimated from fractional inhibition at negative voltages (Swartz and MacKinnon, 1997a; Phillips et al., 2005). Smooth curves are fits of Fu = (1 − P)4 where P = [Toxin]/([Toxin] + Kd) with Kd = 298 ± 14 nM for unmodified membranes (gray), and Kd = 170 ± 10 nM after SMaseD treatment (blue). Leak, background, and capacitive currents were subtracted after blocking the channel with agitoxin-2. In all case data points are the mean ± SEM (n = 3).
Figure 10.
Figure 10.
Interaction of tarantula toxins with voltage-sensor paddles within the membrane. Illustration of SGTx1 partitioning into the membrane and interacting with S3–S4 helices. Side chain colors for left SGTx1 structure are green for hydrophobic, blue for basic, red for acidic, pink for Ser/Thr, and gray for other side chains and backbone atoms. Right SGTx1 structure shows residues important for protein–protein interactions in light blue. In both cases G32-F34 have been removed for clarity. Backbone fold of the activated/open conformation of the Kv1.2 (protein database accession code2A79) shown with only one of four voltage-sensing domains. Side chains of the outer four S4 Arg residues are shown and both S1 and S2 helices have been deleted for clarity. The contribution of the back subunit to the pore domain has also been omitted for clarity. Purple spheres are positions of potassium ions within the ion conduction pathway.

Similar articles

Cited by

References

    1. Ahern, C.A., and R. Horn. 2004. Stirring up controversy with a voltage sensor paddle. Trends Neurosci. 27:303–307. - PubMed
    1. Andersen, O.S., C. Nielsen, A.M. Maer, J.A. Lundbaek, M. Goulian, and R.E. Koeppe II. 1999. Ion channels as tools to monitor lipid bilayer-membrane protein interactions: gramicidin channels as molecular force transducers. Methods Enzymol. 294:208–224. - PubMed
    1. Bemporad, D., Z.A. Sands, C.L. Wee, A. Grottesi, and M.S. Sansom. 2006. Vstx1, a modifier of Kv channel gating, localizes to the interfacial region of lipid bilayers. Biochemistry. 45:11844–11855. - PubMed
    1. Beschiaschvili, G., and J. Seelig. 1990. Melittin binding to mixed phosphatidylglycerol/phosphatidylcholine membranes. Biochemistry. 29:52–58. - PubMed
    1. Burstein, E.A., S.M. Abornev, and Y.K. Reshetnyak. 2001. Decomposition of protein tryptophan fluorescence spectra into log-normal components. I. Decomposition algorithms. Biophys. J. 81:1699–1709. - PMC - PubMed

Publication types