. 2007 Oct 15;21(20):2545-57.
doi: 10.1101/gad.1588207.

Jmjd1a and Jmjd2c histone H3 Lys 9 demethylases regulate self-renewal in embryonic stem cells

Affiliations

Jmjd1a and Jmjd2c histone H3 Lys 9 demethylases regulate self-renewal in embryonic stem cells

Yuin-Han Loh et al. Genes Dev. .

Abstract

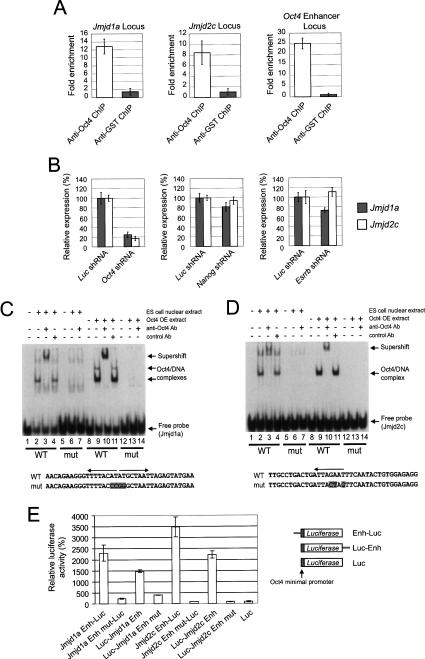
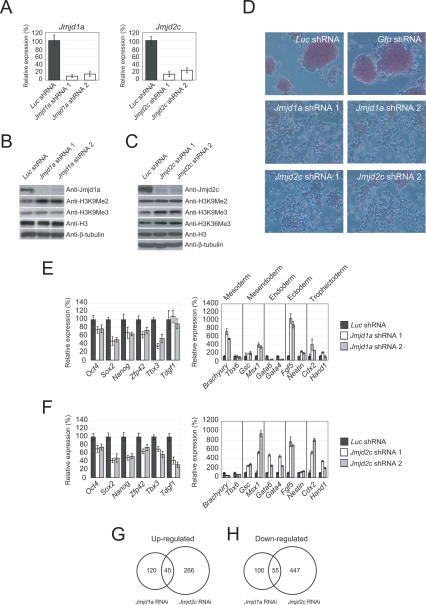
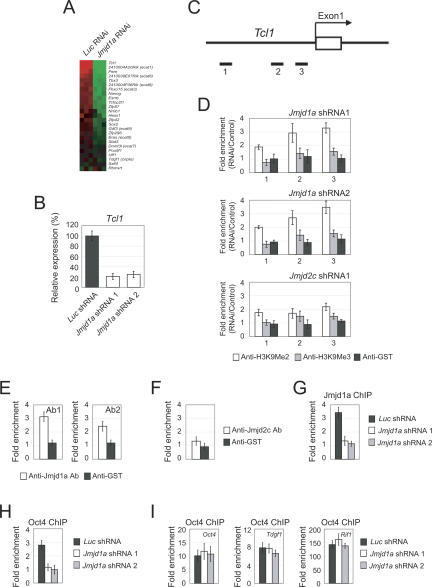
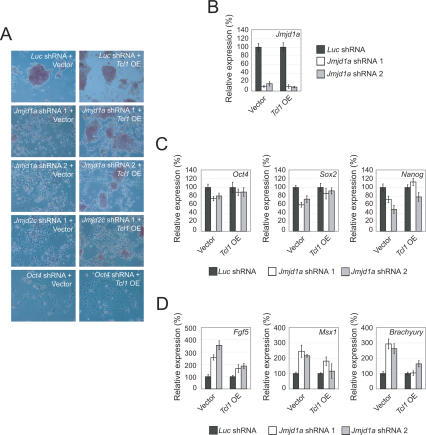
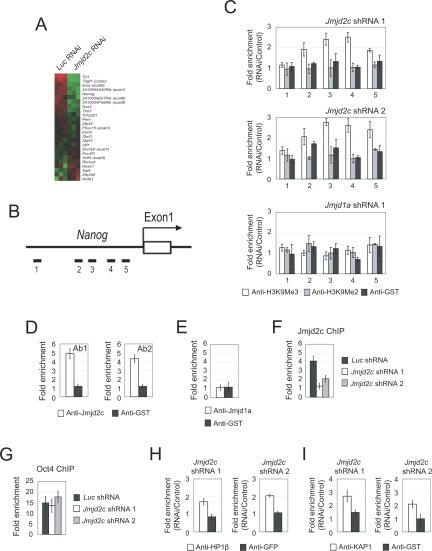
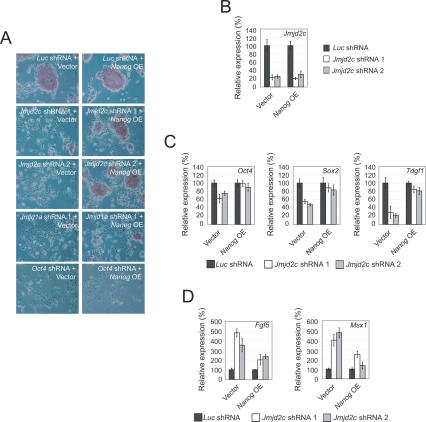
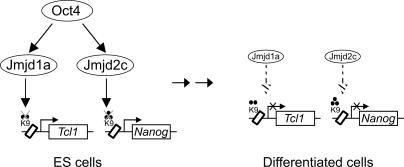
Embryonic stem (ES) cells are pluripotent cells with the ability to self-renew indefinitely. These unique properties are controlled by genetic factors and chromatin structure. The exit from the self-renewing state is accompanied by changes in epigenetic chromatin modifications such as an induction in the silencing-associated histone H3 Lys 9 dimethylation and trimethylation (H3K9Me2/Me3) marks. Here, we show that the H3K9Me2 and H3K9Me3 demethylase genes, Jmjd1a and Jmjd2c, are positively regulated by the ES cell transcription factor Oct4. Interestingly, Jmjd1a or Jmjd2c depletion leads to ES cell differentiation, which is accompanied by a reduction in the expression of ES cell-specific genes and an induction of lineage marker genes. Jmjd1a demethylates H3K9Me2 at the promoter regions of Tcl1, Tcfcp2l1, and Zfp57 and positively regulates the expression of these pluripotency-associated genes. Jmjd2c acts as a positive regulator for Nanog, which encodes for a key transcription factor for self-renewal in ES cells. We further demonstrate that Jmjd2c is required to reverse the H3K9Me3 marks at the Nanog promoter region and consequently prevents transcriptional repressors HP1 and KAP1 from binding. Our results connect the ES cell transcription circuitry to chromatin modulation through H3K9 demethylation in pluripotent cells.


Figures

Figure 1.
Figure 1.
Oct4 regulates the expression of Jmjd1a and Jmjd2c in pluripotent mouse ES cells. (A) Oct4 binds to the intronic regions of Jmjd1a and Jmjd2c. Real-time PCR detection of enriched fragments from ChIP assays in ES cells using Oct4 or control antibodies. Fold enrichment is the relative abundance of DNA fragments at the amplified region (see Supplementary Fig. 1) over a control amplified region. Validation of Oct4 ChIP was carried out using primers specific for known binding sites at the Oct4 enhancer locus. GST (glutathione S-transferase) antibody was used as a mock ChIP control. Data are presented as the mean ± SEM. (B) Oct4 knockdown down-regulated endogenous Jmjd1a and Jmjd2c mRNA levels. Oct4 suppression in ES cells by RNAi resulted in concomitant reductions in endogenous Jmjd1a and Jmjd2c. Nanog and Esrrb RNAi-transfected ES cells exhibited little or no reduction in Jmjd1a and Jmjd2c mRNA. cDNAs were prepared from the knockdown mouse ES cells and were analyzed using real-time PCR. The levels of the transcripts were normalized against control Luc (Luciferase) shRNA-transfected cells. After 24 h of transfection, the ES cells were selected for 3 d before harvest. Data are presented as the mean ± SEM. (C) Oct4 binds to the intronic sequences of Jmjd1a. EMSA was used to analyze the interactions between Oct4 and a 27-bp double-stranded DNA probe containing the oct elements (indicated by arrows). Both ES cell nuclear extracts and extracts from 293 cells overexpressing Oct4 (Oct4 OE extracts) were used for EMSAs. (Lanes 3,10) EMSA with the wild-type probe detected specific Oct4/DNA complexes as confirmed by supershift analysis. (Lanes 6,7,13,14) When mutant probe was used, no interaction was detected. The bottom panel shows the sequence of the oct elements and corresponding mutations (shaded) used in this study. (D) Oct4 binds to the intronic sequences of Jmjd2c. EMSA was used to analyze the interactions between Oct4 and a 27-bp double-stranded DNA probe containing the oct element (indicated by arrow). (Lanes 3,10) EMSA with the wild-type probe detected a specific Oct4/DNA complex as confirmed by supershift analysis. (Lanes 6,7,13,14) When mutant probe was used, no interaction was detected. The bottom panel shows the sequence of the oct element and corresponding mutations (shaded) used in this study. (E) The Oct4-bound intronic regions of Jmjd1a (a 655-bp fragment) or Jmjd2c (a 679-bp fragment) was inserted either upstream of (Enh-Luc) or downstream from (Luc-Enh) a luciferase gene driven by an Oct4 minimal promoter. Reporters were transiently transfected into ES cells for 3 d before measurement of luciferase activities. Enhancer constructs with mutated Oct4-binding sites (Jmjd1a/Jmjd2c Enh-Luc Mut or Jmjd1a/Jmjd2c Luc-Enh Mut) were also tested for enhancer activity in ES cells. For each transfection, we cotransfected a construct expressing Renilla luciferase driven by SV40 promoter to serve as an internal control. Data are presented as the mean ± SEM.
Figure 2.
Figure 2.
Jmjd1a and Jmjd2c are required for the maintenance of self-renewal of ES cells. (A) Quantitative real-time PCR analysis of Jmjd1a and Jmjd2c expression after knockdown using two shRNA constructs targeting different regions of the respective transcripts. After 24 h of transfection, the ES cells were selected for 4 d before harvest. The levels of the transcripts were normalized against control Luc shRNA-transfected cells. Data are presented as the mean ± SEM. (B) Reduction of Jmjd1a after RNAi-mediated knockdown led to increased H3K9Me2. Western blot analyses of Jmjd1a knockdown and control ES cell lysates were carried out using anti-Jmjd1a, anti-H3K9Me2, or anti-H3K9Me3 antibodies. Anti-histone H3 and anti-β-tubulin antibodies were used as loading controls. (C) Reduction of Jmjd2c after RNAi-mediated knockdown led to increased H3K9Me3. Western blot analyses of Jmjd2c knockdown and control ES cell lysate were carried out using anti-Jmjd2c, anti-H3K9Me2, anti-H3K9Me3, or anti-H3K36Me3 antibodies. Anti-histone H3 and anti-β-tubulin antibodies were used as loading controls. (D) Jmjd1a and Jmjd2c knockdown led to differentiation. Flattened fibroblast-like cells were formed after Jmjd1a or Jmjd2c depletion. For control Luc or Gfp shRNA-transfected cells, distinct alkaline phosphatase-positive (red staining) ES cell colonies were maintained. The cells were stained after 4 d of puromycin selection. (E) Real-time PCR analysis of ES cell-associated gene expression (left panel) and lineage-specific marker gene expression (right panel) in Jmjd1a knockdown ES cells. The levels of the transcripts were normalized against control Luc shRNA-transfected cells. Data are presented as the mean ± SEM. (F) Real-time PCR analysis of ES cell-associated gene expression (left panel) and lineage-specific marker gene expression (right panel) in Jmjd2c knockdown ES cells. The levels of transcripts were normalized against control Luc shRNA-transfected cells. Data are presented as the mean ± SEM. (G) Venn diagram of overlapping and specifically up-regulated genes between Jmjd1a- and Jmjd2c-depleted ES cells. DNA microarrays were used to profile the gene expression of these cells. The levels of transcripts were compared with control Luc shRNA-transfected cells. The P-value for the overlap as computed using Monte Carlo simulation is <1e−08. (H) Venn diagram of overlapping and specifically down-regulated genes between Jmjd1a- and Jmjd2c-depleted ES cells. DNA microarrays were used to profile the gene expression of these cells. The levels of transcripts were compared with control Luc shRNA-transfected cells. The P-value for the overlap as computed using Monte Carlo simulation is <1e−08.
Figure 3.
Figure 3.
Jmjd1a regulates expression of Tcl1 through demethylation of H3K9Me2. (A) Microarray heat map depicting expression changes of selected ES cell-associated genes (Ivanova et al. 2002; Ramalho-Santos et al. 2002; Mitsui et al. 2003) after Jmjd1a knockdown. The gene expression levels were mean-centered to show their relative changes, and the genes were ordered according to their mean fold changes. (B) Jmjd1a positively regulates the expression of Tcl1. The expression of Tcl1 was analyzed after depletion of Jmjd1a using two shRNA constructs. After 24 h of transfection, the ES cells were selected with puromycin for 4 d before harvest. The levels of the transcripts were normalized against control Luc (Luciferase) shRNA-transfected cells. Data are presented as the mean ± SEM. (C) Schematic showing the locations of the amplicons (black bars labeled 1–3) used to detect ChIP-enriched fragments over the Tcl1 promoter. Amplicons are numbered in order relative to their sites along the gene. The open box represents an exon. (D) Analysis of H3K9Me2/Me3 modifications along the Tcl1 promoter by ChIP. ES cells were transfected with Luc (control) shRNA, Jmjd1a shRNA 1, Jmjd1a shRNA 2, or Jmjd2c shRNA 1. Fold enrichment is the relative abundance of DNA fragments detected by real-time PCR at the amplified region over a control amplified region and normalized with control Luc. GST antibody was used as a ChIP control. Data are presented as the mean ± SEM. (E) Jmjd1a interacts with the Tcl1 promoter region. ChIP assays were performed with two different anti-Jmjd1a antibodies. A primer pair targeting amplicon 3 was used. GST antibody was used as a ChIP control. Data are presented as the mean ± SEM. (F) Jmjd2c ChIP and real-time PCR showed no enrichment over the Tcl1 promoter region. Data are presented as the mean ± SEM. (G) Knockdown of Jmjd1a abolished the ChIP signal derived from anti-Jmjd1a antibody. ES cells were transfected with control Luc shRNA, Jmjd1a shRNA 1, or Jmjd1a shRNA 2. Data are presented as the mean ± SEM. (H) ChIP analysis showed that Oct4 binding to the Tcl1 promoter was diminished upon Jmjd1a depletion. ES cells were transfected with control Luc shRNA, Jmjd1a shRNA 1, or Jmjd1a shRNA 2. A primer pair targeting amplicon 3 was used. Data are presented as the mean ± SEM. (I) Oct4 binding at Oct4 enhancer and Tdgf1 and Rif1 loci was not affected in Jmjd1a depletion. Data are presented as the mean ± SEM.
Figure 4.
Figure 4.
Tcl1 is the key downstream effector of Jmjd1a responsible for maintaining ES cells’ self-renewal. (A) Enforced Tcl1 overexpression (OE) could rescue the differentiation phenotype induced by Jmjd1a depletion. ES cells were transfected with a Tcl1-overexpressing vector and challenged with shRNA directing against various transcripts (Jmjd1a, Jmjd2c, or Oct4). The cells were stained for alkaline phosphatase activity, and the morphologies were examined by microscopy after 4 d of puromycin selection. Note the morphological rescue and the maintenance of alkaline phosphatase-positive colonies in Jmjd1a shRNA-treated cells. Little or no morphological rescue was observed when the cells were challenged with Jmjd2c or Oct4 shRNA, respectively. (B) Jmjd1a was similarly depleted both in Tcl1-overexpressing and control ES cells. Quantitative real-time PCR analysis of Jmjd1a expression after knockdown using two shRNA constructs cotransfected into ES cells with either control or Tcl1-overexpressing vector. The levels of the transcripts were normalized against control plasmid-transfected cells. Data are presented as the mean ± SEM. (C) Enforced Tcl1 overexpression reduced the down-regulation of Sox2 and Nanog upon Jmjd1a depletion. The levels of the transcripts were normalized against control plasmid transfected cells. Data are presented as the mean ± SEM. (D) Enforced Tcl1 overexpression compensated for the Jmjd1a loss of function by reducing the induction of differentiation markers Fgf5, Msx1, and Brachyury. Data are presented as the mean ± SEM.
Figure 5.
Figure 5.
Jmjd2c regulates expression of Nanog through demethylation of H3K9Me3. (A) Microarray heat map plot depicting expression changes of selected ES cell-associated genes (Ivanova et al. 2002; Ramalho-Santos et al. 2002; Mitsui et al. 2003) after Jmjd2c knockdown. The gene expression levels were mean-centered to show their relative changes, and the genes were ordered according to their mean fold changes. (B) Schematic showing the location of the amplicons (black bars labeled 1–5) used to detect ChIP-enriched fragments over the Nanog promoter. Amplicons are numbered in order relative to their sites along the gene. The open box represents an exon. (C) Analysis of H3K9Me2/Me3 modifications along the Nanog promoter region by ChIP. ES cells were transfected with Luc (control) shRNA, Jmjd2c shRNA 1, Jmjd2c shRNA 2, or Jmjd1a shRNA 1. Fold enrichment is the relative abundance of DNA fragments detected by real-time PCR at the amplified region over a control amplified region and normalized with control Luc. GST antibody was used as a ChIP control. Data are presented as the mean ± SEM. (D) Jmjd2c associates with the Nanog promoter region. ChIP assays were performed with two different anti-Jmjd2c antibodies. A primer pair targeting amplicon 3 was used. GST antibody was used as a ChIP control. Data are presented as the mean ± SEM. (E) ChIP analysis showed no enrichment of Jmjd1a over the Nanog promoter region. A primer pair targeting amplicon 3 was used. Data are presented as the mean ± SEM. (F) Knockdown of Jmjd2c abolished the ChIP signal derived from anti-Jmjd2c antibody. ES cells were transfected with control Luc shRNA, Jmjd2c shRNA 1, or Jmjd2c shRNA 2. A primer pair targeting amplicon 3 was used. Data are presented as the mean ± SEM. (G) ChIP analysis showed Oct4 binding to the Nanog promoter remained unchanged upon Jmjd2c depletion. ES cells were transfected with control Luc shRNA, Jmjd2c shRNA 1, or Jmjd2c shRNA 2. A primer pair targeting amplicon 5 was used. Data are presented as the mean ± SEM. (H) ChIP analysis showed that HP1-β binding to the Nanog promoter was increased upon Jmjd2c depletion. ES cells were transfected with Luc shRNA (control), Jmjd2c shRNA 1, or Jmjd2c shRNA 2. A primer pair targeting amplicon 3 was used. Data are presented as the mean ± SEM. (I) ChIP analysis showed that KAP1 binding to the Nanog promoter was increased upon Jmjd2c depletion. ES cells were transfected with Luc shRNA (control), Jmjd2c shRNA 1, or Jmjd2c shRNA 2. A primer pair targeting amplicon 3 was used. Data are presented as the mean ± SEM.
Figure 6.
Figure 6.
Nanog is the key downstream effector of Jmjd2c responsible for maintaining ES cells’ self-renewal. (A) Overexpression of Nanog can rescue differentiation phenotype induced by Jmjd2c depletion. ES cells with constitutive Nanog overexpression (Loh et al. 2006) were challenged with shRNA directing against various transcripts (Jmjd2c, Jmjd1a, or Oct4). The cells were stained for alkaline phosphatase activity, and the morphologies were examined by microscopy. Note the morphological rescue and the maintenance of alkaline phosphatasepositive colonies in Jmjd2c shRNA-treated cells. Little or no morphological rescue was observed when the cells were challenged with Jmjd1a or Oct4 shRNA, respectively. (B) Jmjd2c was similarly depleted both in Nanog-overexpressing and control ES cells. Data are presented as the mean ± SEM. (C) Overexpression of Nanog reduced the down-regulation of Oct4, Sox2, and Tdgf1 upon Jmjd2c depletion. The levels of the transcripts were normalized against control plasmid-transfected cells. Data are presented as the mean ± SEM. (D) Enforced Nanog overexpression compensated for the Jmjd2c loss of function by reducing the induction of differentiation markers Fgf5 and Msx1. Data are presented as the mean ± SEM.
Figure 7.
Figure 7.
Model for the maintenance of self-renewal of ES cells by Jmjd1a and Jmjd2c. Schematic showing the interplay of Oct4 with Jmjd1a and Jmjd2c in sustaining ES cells’ self-renewal. In ES cells, Oct4 up-regulates the levels of Jmjd1a and Jmjd2c. Jmjd1a and Jmjd2c maintain Tcl1 and Nanog by demethylation of the repressive H3K9Me2 and H3K9Me3 marks, respectively. Notably, Tcl1 and Nanog are both downstream targets of Oct4. With differentiation, the down-regulation of Jmjd1a and Jmjd2c (dashed arrows) results in an elevation of the repressive H3K9Me2/Me3 modifications and reduced expression of downstream genes.

Comment in

References

    1. Avilion A.A., Nicolis S.K., Pevny L.H., Perez L., Vivian N., Lovell-Badge R., Nicolis S.K., Pevny L.H., Perez L., Vivian N., Lovell-Badge R., Pevny L.H., Perez L., Vivian N., Lovell-Badge R., Perez L., Vivian N., Lovell-Badge R., Vivian N., Lovell-Badge R., Lovell-Badge R. Multipotent cell lineages in early mouse development depend on SOX2 function. Genes & Dev. 2003;17:126–140. - PMC - PubMed
    1. Azuara V., Perry P., Sauer S., Spivakov M., Jørgensen H.F., John R.M., Gouti M., Casanova M., Warnes G., Merkenschlager M., Perry P., Sauer S., Spivakov M., Jørgensen H.F., John R.M., Gouti M., Casanova M., Warnes G., Merkenschlager M., Sauer S., Spivakov M., Jørgensen H.F., John R.M., Gouti M., Casanova M., Warnes G., Merkenschlager M., Spivakov M., Jørgensen H.F., John R.M., Gouti M., Casanova M., Warnes G., Merkenschlager M., Jørgensen H.F., John R.M., Gouti M., Casanova M., Warnes G., Merkenschlager M., John R.M., Gouti M., Casanova M., Warnes G., Merkenschlager M., Gouti M., Casanova M., Warnes G., Merkenschlager M., Casanova M., Warnes G., Merkenschlager M., Warnes G., Merkenschlager M., Merkenschlager M., et al. Chromatin signatures of pluripotent cell lines. Nat. Cell Biol. 2006;8:532–538. - PubMed
    1. Bannister A.J., Zegerman P., Partridge J.F., Miska E.A., Allshire R.C., Kouzarides T., Zegerman P., Partridge J.F., Miska E.A., Allshire R.C., Kouzarides T., Partridge J.F., Miska E.A., Allshire R.C., Kouzarides T., Miska E.A., Allshire R.C., Kouzarides T., Allshire R.C., Kouzarides T., Kouzarides T. Selective recognition of methylated lysine 9 on histone H3 by the HP1 chromo domain. Nature. 2001;410:120–124. - PubMed
    1. Bernstein B.E., Mikkelsen T.S., Xie X., Kamal M., Huebert D.J., Cuff J., Fry B., Meissner A., Wernig M., Plath K., Mikkelsen T.S., Xie X., Kamal M., Huebert D.J., Cuff J., Fry B., Meissner A., Wernig M., Plath K., Xie X., Kamal M., Huebert D.J., Cuff J., Fry B., Meissner A., Wernig M., Plath K., Kamal M., Huebert D.J., Cuff J., Fry B., Meissner A., Wernig M., Plath K., Huebert D.J., Cuff J., Fry B., Meissner A., Wernig M., Plath K., Cuff J., Fry B., Meissner A., Wernig M., Plath K., Fry B., Meissner A., Wernig M., Plath K., Meissner A., Wernig M., Plath K., Wernig M., Plath K., Plath K., et al. A bivalent chromatin structure marks key developmental genes in embryonic stem cells. Cell. 2006;125:315–326. - PubMed
    1. Boyer L.A., Lee T.I., Cole M.F., Johnstone S.E., Levine S.S., Zucker J.P., Guenther M.G., Kumar R.M., Murray H.L., Jenner R.G., Lee T.I., Cole M.F., Johnstone S.E., Levine S.S., Zucker J.P., Guenther M.G., Kumar R.M., Murray H.L., Jenner R.G., Cole M.F., Johnstone S.E., Levine S.S., Zucker J.P., Guenther M.G., Kumar R.M., Murray H.L., Jenner R.G., Johnstone S.E., Levine S.S., Zucker J.P., Guenther M.G., Kumar R.M., Murray H.L., Jenner R.G., Levine S.S., Zucker J.P., Guenther M.G., Kumar R.M., Murray H.L., Jenner R.G., Zucker J.P., Guenther M.G., Kumar R.M., Murray H.L., Jenner R.G., Guenther M.G., Kumar R.M., Murray H.L., Jenner R.G., Kumar R.M., Murray H.L., Jenner R.G., Murray H.L., Jenner R.G., Jenner R.G., et al. Core transcriptional regulatory circuitry in human embryonic stem cells. Cell. 2005;122:947–956. - PMC - PubMed

Publication types

MeSH terms