. 2007 Oct 22;179(2):341-56.
doi: 10.1083/jcb.200611106. Epub 2007 Oct 15.

Plasma membrane domain organization regulates EGFR signaling in tumor cells

Affiliations

Plasma membrane domain organization regulates EGFR signaling in tumor cells

Patrick Lajoie et al. J Cell Biol. .

Abstract

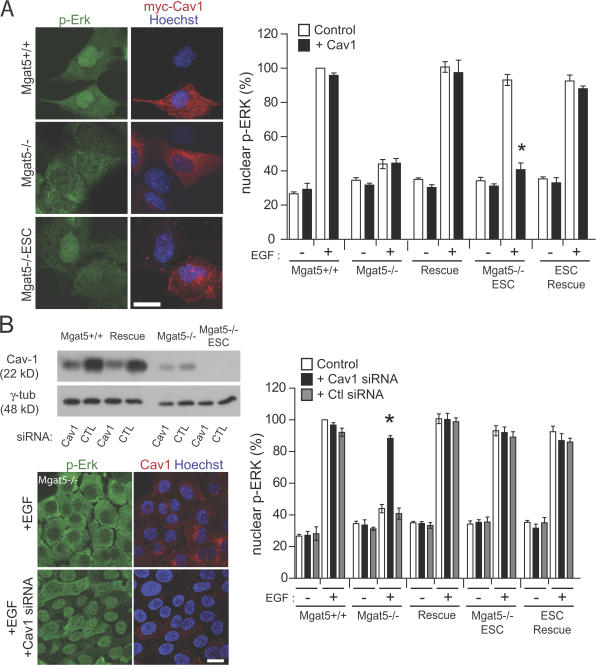
Macromolecular complexes exhibit reduced diffusion in biological membranes; however, the physiological consequences of this characteristic of plasma membrane domain organization remain elusive. We report that competition between the galectin lattice and oligomerized caveolin-1 microdomains for epidermal growth factor (EGF) receptor (EGFR) recruitment regulates EGFR signaling in tumor cells. In mammary tumor cells deficient for Golgi beta1,6N-acetylglucosaminyltransferase V (Mgat5), a reduction in EGFR binding to the galectin lattice allows an increased association with stable caveolin-1 cell surface microdomains that suppresses EGFR signaling. Depletion of caveolin-1 enhances EGFR diffusion, responsiveness to EGF, and relieves Mgat5 deficiency-imposed restrictions on tumor cell growth. In Mgat5(+/+) tumor cells, EGFR association with the galectin lattice reduces first-order EGFR diffusion rates and promotes receptor interaction with the actin cytoskeleton. Importantly, EGFR association with the lattice opposes sequestration by caveolin-1, overriding its negative regulation of EGFR diffusion and signaling. Therefore, caveolin-1 is a conditional tumor suppressor whose loss is advantageous when beta1,6GlcNAc-branched N-glycans are below a threshold for optimal galectin lattice formation.


Figures

Figure 1.
Figure 1.
Mgat5−/−ESC cells show enhanced responsiveness to EGF. (A) Scan array determination of phospho-Erk nuclear translocation in Mgat5+/+, Mgat5−/−, and Mgat5−/−ESC cells after stimulation with 100 ng/ml EGF for the indicated times of incubation. Representative phospho-Erk labeling of cells upon EGF stimulation for 5 min are shown. (B) Scan array determination of Smad nuclear translocation in Mgat5+/+, Mgat5−/−, and Mgat5−/−ESC cells after stimulation with 100 ng/ml TGF-β for the indicated times of incubation. (C) In contrast to Mgat5+/+ cells, Mgat5−/− and Mgat5−/−ESC tumor cells display E-cadherin–labeled (green) epithelial cell–cell adherens junctions (top) and little fibronectin organized into fibrils (green). Cell nuclei are labeled with Hoechst (blue). Error bars represent SEM. Bars, 20 μm.
Figure 2.
Figure 2.
Reduced Cav1 levels are associated with tumor growth in an Mgat5−/− background. (A) Mgat5+/+, Mgat5−/−, Rescue, Mgat5−/−ESC, and ESC-Rescue cells were grown on coverslips for 48 h and stained with L-PHA–FITC (green; top) or Cav1 (green; bottom). Cell nuclei are stained with Hoechst (blue). Quantification of L-PHA and Cav1 intensity is shown as a bar graph (n = 3; >25 cells per condition). (B) Equal protein amounts of cell lysates from Mgat5+/+(2.6) and (2.8), Mgat5−/− and Mgat5−/−ESC, and Rescue and ESC-Rescue cells were Western blotted with Cav1/2 or Cav1-specific antibodies as indicated and quantified by densitometry. Mgat5+/+ were treated with 1 μM swainsonine (SW) or 20 mM β-lactose (β-lac) for 48 h, blotted for Cav1/2 and β-actin, and quantified by densitometry. (C) Representative electron micrographs of the plasma membrane of Mgat5+/+, Mgat5−/−, and Mgat5−/−ESC cells. Quantification revealed that both Mgat5-deficient cell lines present reduced the expression of caveolae but not clathrin-coated pits. (D) Spontaneous MMTV-PyMT mammary carcinomas were dissected from 12-wk-old Mgat5+/− and Mgat5−/− mice and subjected to quantitative Western blotting of Cav1 expression levels. Blots were also probed with γ-tubulin as a loading control, and levels of Cav1 were normalized to γ-tubulin levels as determined by densitometry. Results are plotted against tumor volume. *, P < 0.05; **, P < 0.005 relative to Mgat5+/+ unless otherwise indicated. Error bars represent SEM. Bars (A), 20 μm; (C) 0.2 μm.
Figure 3.
Figure 3.
Cav1 regulation of EGF signaling is selective for an Mgat5−/− background. (A) Mgat5+/+, Mgat5−/−, Rescue, Mgat5−/−ESC, and ESC-Rescue cells were infected with adenoviruses coding for myc-tagged Cav1 before stimulation with 100 ng/ml EGF for 5 min. Cells were fixed and stained for phospho-Erk (green) and Cav1 (red), and nuclei were identified by Hoechst staining (blue). Quantification of untreated and EGF-treated cells presenting nuclear phospho-Erk is shown as a bar graph (n = 3; >36 cells per condition). (B) Mgat5+/+, Rescue, Mgat5−/−, and Mgat5−/−ESC cells were treated with Cav1 siRNA, nonspecific (CTL) siRNA, or were left untreated (none) and blotted for Cav1 and γ-tubulin (γ-tub). Mgat5+/+, Mgat5−/−, Rescue, Mgat5−/−ESC, and ESC-Rescue cells were transfected with nonspecific (CTL) siRNA or siRNA coding for Cav1 before stimulation with 100 ng/ml EGF for 5 min. Cells were fixed and stained for phospho-Erk (green) and Cav1 (red), nuclei were identified by Hoechst staining (blue), and representative confocal images of untreated and Cav1 siRNA–treated Mgat5−/− cells are shown. The percentage of cells presenting nuclear phospho-Erk was quantified in untreated and EGF-treated cells that were either untransfected (white bars) or transfected with Cav1 (black bars) or control (gray bars) siRNA and is shown as a bar graph (n = 3; >48 cells per condition). Error bars represent SEM. *, P < 0.01 relative to control untransfected cells. Bars, 20 μm.
Figure 4.
Figure 4.
Cav1 regulation of plasma membrane diffusion of CT-B–FITC and EGFR-YFP. (A). Mgat5+/+, Mgat5−/−, and Mgat5−/−ESC cells were incubated with 5 μg/ml FITC–CT-B at room temperature, and a portion of the cytoplasm was bleached and imaged for fluorescent recovery. Percent intensity ± SEM (error bars) of FITC–CT-B in the bleached zone during recovery is shown for one representative experiment (n = 6 cells) for Mgat5+/+ (left), Mgat5−/− (middle), and Mgat5−/−ESC (right) cells either untransfected (red) or transfected with Cav1 siRNA (blue) or Cav1-mRFP (+Cav1; black) as indicated. (B) Alternatively, Mgat5+/+ (left), Mgat5−/− (middle), and Mgat5−/−ESC (right) cells transfected with EGFR-YFP (red) and subsequently transfected with Cav1 siRNA (blue) or infected with Cav1 adenovirus (+Cav1; black) were maintained at room temperature, and a portion of the cytoplasm was bleached and imaged for fluorescent recovery. Percent intensity ± SEM of FITC–CT-B in the bleached zone during recovery is shown for one representative experiment (n = 6 cells). See Table I for quantitative values for all conditions tested. (C) Representative images of an EGR-YFP–transfected cell are shown prebleach, immediately after bleaching (T = 0), and after recovery (240 s). Bar, 20 μM.
Figure 5.
Figure 5.
Cav1 regulation of EGFR signaling and cell surface diffusion requires an intact scaffolding domain but not Y14 phosphorylation. (A) N-octylglucoside lysates of Mgat5+/+ and Mgat5−/− cells were analyzed by velocity sucrose gradient centrifugation, and fractions were immunoblotted for Cav1 and monomeric RhoA as indicated. Fraction 1 is the top of the gradient, and fraction 12 is the bottom. (B) N-octylglucoside lysates of Mgat5+/+ and Mgat5−/− cells were separated on blue native gels and blotted for Cav1. (C) Mgat5−/−ESC cells were transfected with Cav1-mRFP, and Cav1 diffusion was assessed by FRAP. Cav1 intensity in the bleached zone was determined by comparison of Cav1 labeling intensity with RFP fluorescence in fixed cells and was normalized to Cav1 intensity in Mgat5+/+ cells. Representative confocal images of high and low Cav1-mRFP–expressing cells are presented. Red boxed areas are enlarged in the insets to show details of Cav1 distribution. Mobile fraction (top graph) and half-time of recovery (bottom graph) in the function of Cav1 expression are presented. Linear regressions of the data points are shown as red lines. (D) Mgat5−/−ESC cells were co-transfected with myc-tagged Cav1 wild type, Y14F mutant, or F92A/V94A scaffolding domain mutant as well as pOCT-dsRed to identify transfected cells and were incubated with CT-B–FITC at room temperature. Alternatively, myc-tagged Cav1 and mutants were cotransfected with EGFR-YFP. Percent intensity ± SEM (error bars) in the bleached zone for CT-B–FITC and EGFR-YFP during recovery is shown for one representative experiment (n = 6 cells). See Table I for quantitative values for all conditions tested. (E) Mgat5−/−ESC cells were transfected with myc-tagged Cav1 wild type (WT), Y14F mutant, or F92A/V94A scaffolding domain mutant. Cells stimulated with 100 ng/ml EGF for 5 min were fixed and stained with anti–phospho-Erk and anti-myc to identify myc-tagged Cav1-labeled cells. Nuclei were identified by Hoechst staining. Quantification of phospho-Erk nuclear translocation from confocal images is shown as a bar graph (n = 3; >24 cells per condition). *, P < 0.05. (F) Mgat5−/−ESC cells transfected with myc-tagged Cav1 wild type, Y14F mutant, or F92A/V94A scaffolding domain mutant were immunofluorescently labeled with anti-EGFR (green) and anti-myc to localize myc-Cav1 (red) in the absence of ligand. Red boxed areas are enlarged in the insets to reveal the incidence of colocalization. The percentage of EGFR spots that overlap with Cav1 is presented in graphic form. *, P < 0.05. Bars, 20 μm.
Figure 6.
Figure 6.
The Mgat5/galectin lattice restricts EGFR diffusion and limits interaction with Cav1 domains. (A) Percent intensity ± SEM (error bars) in the bleached zone of EGFR-YFP during recovery is shown for one representative experiment (n = 6 cells) for Mgat5+/+ cells (top) either untreated (Ctl) or treated with 20 mM lactose (+Lac) for 48 h or infected with Cav1 adenovirus and treated with 20 mM lactose for 48 h (+Lac+Cav1). Percent intensity ± SEM in the bleached zone of EGFR-YFP during recovery is shown for one representative experiment (n = 6 cells) for Mgat5−/− and Rescue cells (top) and for Mgat5−/−ESC and ESC-Rescue cells (bottom). See Table I for quantitative values for all conditions tested. (B) Mgat5+/+ and Mgat5−/− cells either untreated or pretreated for 48 h with 20 mM lactose or sucrose (not depicted) were immunofluorescently labeled for EGFR (red) and Cav1 (green) in the absence of ligand. Higher magnification images are presented to reveal the incidence of colocalization. The percentage of EGFR spots that overlap with Cav1 is presented in graphic form. *, P < 0.01 relative to untreated cells. (C) Time-lapse images of Mgat5−/−ESC and ESC-Rescue cells cotransfected with Cav1-CFP and EGFR-YFP were acquired every 10 s for 5 min. Merged images of representative cells expressing high and low Cav1-CFP levels are displayed with equivalent Cav1 acquisition settings and enhanced Cav1 intensity. Images are shown for t = 0, and higher magnifications of regions boxed in red are shown every minute for 5 min to reveal the incidence of colocalization. Cav1-CFP intensity was quantified relative to Mgat5+/+ cells (top graph), and mean Pearson's colocalization coefficients determined from the time-lapse videos are presented for high and low Cav1-expressing cells (bottom graph). See Videos 1–4 (available at http://www.jcb.org/cgi/content/full/jcb.200611106/DC1). Error bars represent SEM. *, P < 0.01. Bars, 20 μm.
Figure 7.
Figure 7.
The actin cytoskeleton restricts EGFR mobility. (A) Mgat5+/+, Mgat5−/−, and Mgat5−/−ESC cells either untreated or treated with LatA for 20 min were fixed and stained with phalloidin-AlexaFluor568 (red) and Hoechst (blue). (B) Percent intensity ± SEM (error bars) in the bleached zone of transfected EGFR-YFP during recovery is shown for one representative experiment (n = 6 cells) of untreated and LatA-treated Mgat5+/+ cells (top) or for untreated and LatA-treated Mgat5+/+ cells infected with Cav1 adenovirus (+Cav1) or transfected with Cav1 siRNA (+Cav1 siRNA; bottom). (C) Percent intensity ± SEM in the bleached zone of transfected EGFR-YFP during recovery is shown for one representative experiment (n = 6 cells) of Mgat5+/+ cells pretreated for 48 h with 20 mM lactose with (+Lac+LatA) or without (+Lac) Lat A (top) as well as untreated and LatA-treated (+LatA) Mgat5−/− and Mgat5−/−ESC (ESC) cells (bottom). See Table II for quantitative values for all conditions tested. Bar, 20 μm.
Figure 8.
Figure 8.
Domain competition between the galectin lattice and oligomerized Cav1 microdomains regulates EGFR signaling. In Mgat5-expressing cells, EGFR is recruited to galectin lattice domains that limit EGFR diffusion, promote interaction with the actin-based membrane skeleton, and limit interaction with negative regulatory oligomerized Cav1 microdomains (A) such that the reduction of Cav1 expression impacts neither EGFR diffusion nor signaling (B). In the absence of the Mgat5/galectin lattice, EGFR freely diffuses across membrane skeleton boundaries and is recruited to Cav1 oligomers as well as caveolae that negatively regulate signaling (D), and Cav1 down-regulation restores EGFR signaling (E). EGFR in the galectin lattice stably interacts with the membrane skeleton (A and B), and depolymerization of the actin cytoskeleton increases EGFR exchange within the galectin lattice but does not enhance the rate of EGFR diffusion or interaction with Cav1 microdomains (C and F). The diagram was adapted from Morone et al. (2006).

References

    1. Ahmad, N., H.J. Gabius, S. Andre, H. Kaltner, S. Sabesan, R. Roy, B. Liu, F. Macaluso, and C.F. Brewer. 2004. Galectin-3 precipitates as a pentamer with synthetic multivalent carbohydrates and forms heterogeneous cross-linked complexes. J. Biol. Chem. 279:10841–10847. - PubMed
    1. Bauer, P.M., J. Yu, Y. Chen, R. Hickey, P.N. Bernatchez, R. Looft-Wilson, Y. Huang, F. Giordano, R.V. Stan, and W.C. Sessa. 2005. Endothelial-specific expression of caveolin-1 impairs microvascular permeability and angiogenesis. Proc. Natl. Acad. Sci. USA.. 102:204–209. - PMC - PubMed
    1. Breuza, L., S. Corby, J.P. Arsanto, M.H. Delgrossi, P. Scheiffele, and A. Le Bivic. 2002. The scaffolding domain of caveolin 2 is responsible for its Golgi localization in Caco-2 cells. J. Cell Sci. 115:4457–4467. - PubMed
    1. Brewer, C.F., M.C. Miceli, and L.G. Baum. 2002. Clusters, bundles, arrays and lattices: novel mechanisms for lectin-saccharide-mediated cellular interactions. Curr. Opin. Struct. Biol. 12:616–623. - PubMed
    1. Capozza, F., T.M. Williams, W. Schubert, S. McClain, B. Bouzahzah, F. Sotgia, and M.P. Lisanti. 2003. Absence of Caveolin-1 sensitizes mouse skin to carcinogen-induced epidermal hyperplasia and tumor formation. Am. J. Pathol. 162:2029–2039. - PMC - PubMed

Publication types

MeSH terms