. 2007 Oct 22;179(2):255-67.
doi: 10.1083/jcb.200706015. Epub 2007 Oct 15.

Bub1 mediates cell death in response to chromosome missegregation and acts to suppress spontaneous tumorigenesis

Affiliations

Bub1 mediates cell death in response to chromosome missegregation and acts to suppress spontaneous tumorigenesis

Karthik Jeganathan et al. J Cell Biol. .

Abstract

The physiological role of the mitotic checkpoint protein Bub1 is unknown. To study this role, we generated a series of mutant mice with a gradient of reduced Bub1 expression using wild-type, hypomorphic, and knockout alleles. Bub1 hypomorphic mice are viable, fertile, and overtly normal despite weakened mitotic checkpoint activity and high percentages of aneuploid cells. Bub1 haploinsufficient mice, which have a milder reduction in Bub1 protein than Bub1 hypomorphic mice, also exhibit reduced checkpoint activity and increased aneuploidy, but to a lesser extent. Although cells from Bub1 hypomorphic and haploinsufficient mice have similar rates of chromosome missegregation, cell death after an aberrant separation decreases dramatically with declining Bub1 levels. Importantly, Bub1 hypomorphic mice are highly susceptible to spontaneous tumors, whereas Bub1 haploinsufficient mice are not. These findings demonstrate that loss of Bub1 below a critical threshold drives spontaneous tumorigenesis and suggest that in addition to ensuring proper chromosome segregation, Bub1 is important for mediating cell death when chromosomes missegregate.


Figures
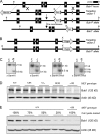
Figure 1.
Figure 1.
Generation of mice with graded reduction in Bub1 dosage. (A) Schematic representation of the primary Bub1 gene–targeting strategy. Part of the Bub1 locus (+), the first targeting vector with loxP sites (gray triangles), the Neo hypomorphic allele, the knockout allele generated by the expression of Cre recombinase (−), BamHI (B) restriction sites, and the Southern probe are indicated. (B) Schematic representation of the second Bub1 gene–targeting strategy. The second targeting vector, the Hyg hypomorphic allele, and the BamHI (B) and XhoI (X) restriction sites for Southern blotting are indicated. (C) Southern blot analysis of mice with the indicated Bub1 genotypes. The 21-kb, 9.8-kb, 8.4-kb, and 9.5-kb fragments represent the wild-type, Neo hypomorphic, knockout, and Hyg hypomorphic alleles, respectively. (D) Western blot analysis of MEFs isolated from mice carrying the indicated Bub1 alleles with a Bub1-specific antibody (actin was used as a loading control). The – and H alleles can produce truncated protein products of 267 amino acids and 318 amino acids, respectively. However, we were unable to detect these truncated products with our polyclonal antibody against Bub1(25–165) (Fig. S1, available at http://www.jcb.org/cgi/content/full/jcb.200706015/DC1), sugesting that the products are rapidly degraded and/or that their messengers are unstable. (E) Quantitation of the level of Bub1 reduction in Bub1−/H MEFs as compared with Bub1+/+ MEFs.
Figure 2.
Figure 2.
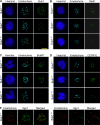
Proper targeting of Mad1 to kinetochores is highly sensitive to Bub1 down-regulation. MEFs with various levels of Bub1 expression were analyzed for the proper localization of proteins whose association with kinetochores or centromeres is known to be Bub1 dependent. (A) Fluorescent images of Bub1+/+, Bub1+/−, and Bub1−/H prophase cells stained for kinetochores, Bub1, and DNA showing that the gradual reduction of cellular Bub1 protein levels corresponds with a gradual decline in kinetochore-associated Bub1 protein. (B) Images of Bub1+/+, Bub1+/−, and Bub1−/H prometaphase cells stained for kinetochores, Mad1, and DNA demonstrating that kinetochore targeting of Mad1 is highly sensitive to Bub1 down-regulation. (C) Fluorescent images of prometaphase cells of the indicated genotypes stained for kinetochores, BubR1, and DNA showing that BubR1 localization to kinetochores is severely perturbed in Bub1−/H MEFs but not in Bub1+/− MEFs. (D) Fluorescent images of prometaphase cells of the indicated genotypes stained for kinetochores, CENP-E, and DNA demonstrating that CENP-E localization to kinetochores is impaired in Bub1−/H MEFs but not in Bub1+/− MEFs. (E) Fluorescent images of Bub1+/+ and Bub1−/H prometaphase cells stained for kinetochores and Sgo1 showing that considerably fewer Sgo1-positive centromeres are present in Bub1−/H MEFs. Bar, 10 μM.
Figure 3.
Figure 3.
Mitotic checkpoint activity analysis. (A) Schematic of the experimental design (for details see the first two paragraphs of Results). (B) Analysis of mitotic checkpoint activity of MEFs of the indicated genotypes (n = 3 for each genotype). Error bars represent the SEM. Dotted arrows mark the times at which 50% of cells had exited from mitosis. Asterisks indicate a statistical difference from Bub1+/+, Bub1+/H, and Bub1+/− MEFs using the logrank test (*, P < 0.001).
Figure 4.
Figure 4.
Bub1 insufficiency causes various chromosome segregation errors. (A) Examples of metaphases with misaligned chromosomes (arrows). (B) Anaphases with lagging chromosomes (arrows). (C) Anaphase with a centrophilic chromosome (arrow).
Figure 5.
Figure 5.
Analysis of cell fate after chromosome missegregation by live cell imaging. MEF cultures expressing YFP-tagged H2B were screened for cells entering mitosis by live cell imaging. Cells undergoing chromosome missegregation were monitored for up to 12 h after the missegregation occurred to determine cell fate. (A) Time-lapse sequence of a Bub1−/H cell undergoing chromosome missegregation and whose daughter cells survived for at least 12 h. t = 0 is the time at which missegregation occurred. (B) Time-lapse sequence of a Bub1+/− cell undergoing chromosome missegregation whose daughter cells died ∼7 h after the defect occurred. (A and B) Arrows mark the locations of the missegregated chromosomes. (C) High resolution images of two Bub1+/− daughter cells undergoing cell death ∼5 h after they underwent chromosome missegregation.
Figure 6.
Figure 6.
Bub1−/H and Bub1H/H mice are prone to spontaneous tumors. (A) Tumor-free survival curves of Bub1+/+, Bub1+/−, Bub1H/H, and Bub1−/H mice. The asterisks mark curves that are significantly different from wild-type using a logrank test (P < 0.0001). We note that the tumor-free survival of a small cohort of Bub1+/H mice (n = 10) was similar to that of Bub1+/+ mice (not depicted). Furthermore, the median tumor-free survival of Bub1−/H mice was significantly shorter than that of Bub1H/H mice (P < 0.01). (B) Spontaneous tumor incidence and tumor latency of Bub1+/+, Bub1+/−, Bub1H/H, and Bub1−/H mice. (C) Tumor spectrum of Bub1+/+, Bub1+/−, Bub1H/H, and Bub1−/H mice. Asterisks mark values that are significantly different from wild type using a Fisher exact Chi-square test. (D) An overt hepatocellular carcinoma is indicated by the dashed line. (D′) Hematoxylin and eosin stained well-differentiated hepatocellular carcinoma, showing a proliferation of mildly atypical hepatocytes with abundant vascular channels, a lack of normal portal tracts, and a nodular focus (arrowheads) with mildly thickened trabeculae. (E) Thymic lymphoma (dashed line). (F) Overt lung adenocarcinoma (dashed circle). (F′) Hematoxylin and eosin–stained low-power magnification of a typical lung adenocarcinoma (dashed circle).
Figure 7.
Figure 7.
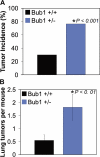
DMBA-induced tumor formation in Bub1 haploinsufficient mice. (A) The occurrence of lung tumors in 5-mo-old mice plotted as the percentage of incidence. (B) The mean number of lung adenomas per mouse ± SEM (error bars). (A and B) The asterisk marks a value that is significantly different from wild type using a chi-squared test (A) and a Wilcoxon rank sum test (B).

Similar articles

Cited by

References

    1. Babu, J.R., K.B. Jeganathan, D.J. Baker, X. Wu, N. Kang-Decker, and J.M. van Deursen. 2003. Rae1 is an essential mitotic checkpoint regulator that cooperates with Bub3 to prevent chromosome missegregation. J. Cell Biol. 160:341–353. - PMC - PubMed
    1. Baker, D.J., K.B. Jeganathan, J.D. Cameron, M. Thompson, S. Juneja, A. Kopecka, R. Kumar, R.B. Jenkins, P.C. de Groen, P. Roche, and J.M. van Deursen. 2004. BubR1 insufficiency causes early onset of aging-associated phenotypes and infertility in mice. Nat. Genet. 36:744–749. - PubMed
    1. Baker, D.J., K.B. Jeganathan, L. Malureanu, C. Perez-Terzic, A. Terzic, and J.M. van Deursen. 2006. Early aging-associated phenotypes in Bub3/Rae1 haploinsufficient mice. J. Cell Biol. 172:529–540. - PMC - PubMed
    1. Boyarchuk, Y., A. Salic, M. Dasso, and A. Arnaoutov. 2007. Bub1 is essential for assembly of the functional inner centromere. J. Cell Biol. 176:919–928. - PMC - PubMed
    1. Cahill, D.P., C. Lengauer, J. Yu, G.J. Riggins, J.K. Willson, S.D. Markowitz, K.W. Kinzler, and B. Vogelstein. 1998. Mutations of mitotic checkpoint genes in human cancers. Nature. 392:300–303. - PubMed

Publication types

MeSH terms

Substances