. 2008 Jan;56(1):77-87.
doi: 10.1369/jhc.7A7301.2007. Epub 2007 Oct 15.

Pax7 reveals a greater frequency and concentration of satellite cells at the ends of growing skeletal muscle fibers

Affiliations

Pax7 reveals a greater frequency and concentration of satellite cells at the ends of growing skeletal muscle fibers

Mohammed Z Allouh et al. J Histochem Cytochem. 2008 Jan.

Abstract

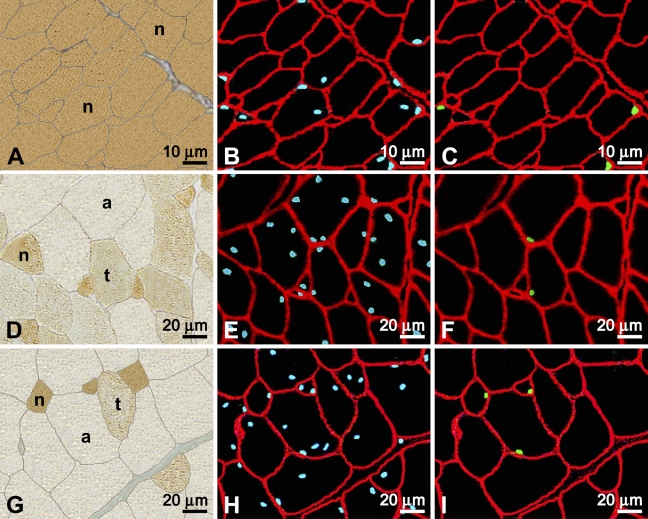
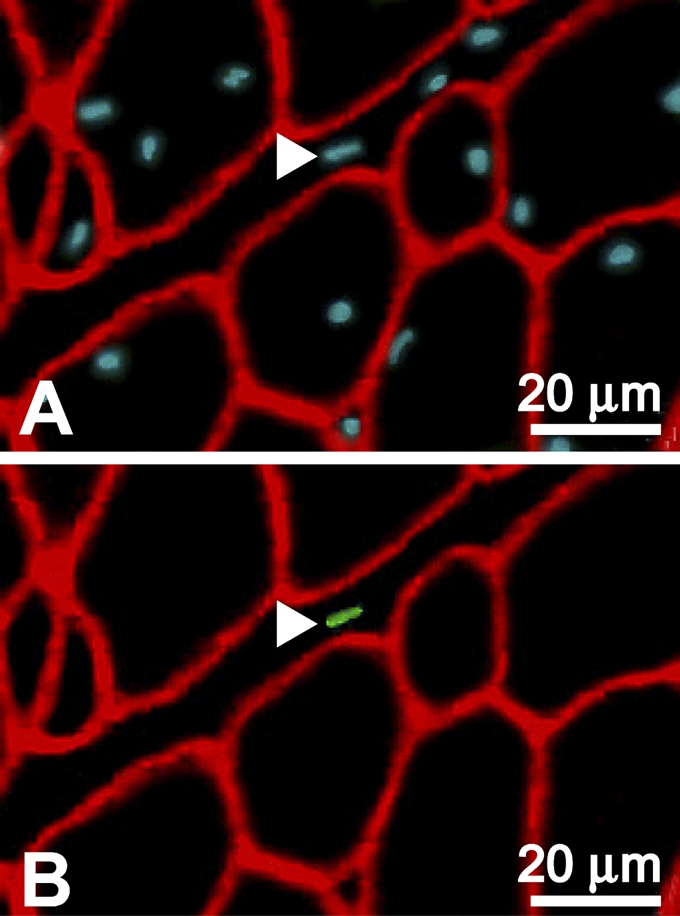
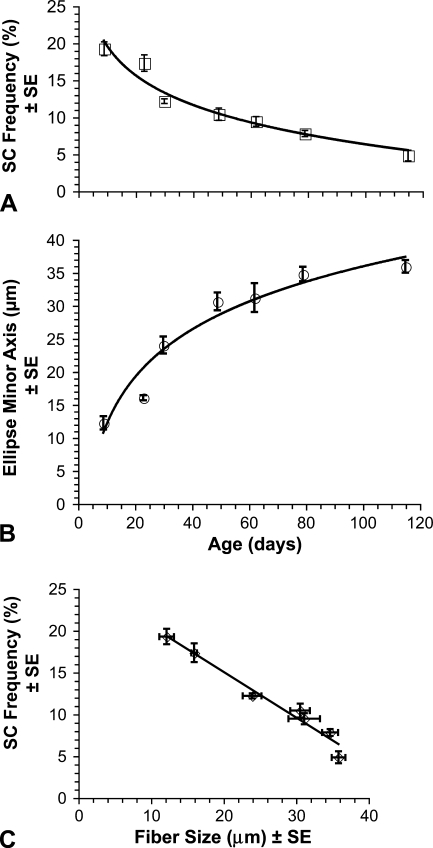
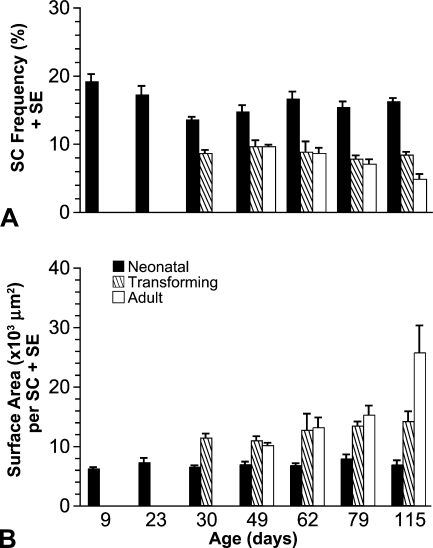
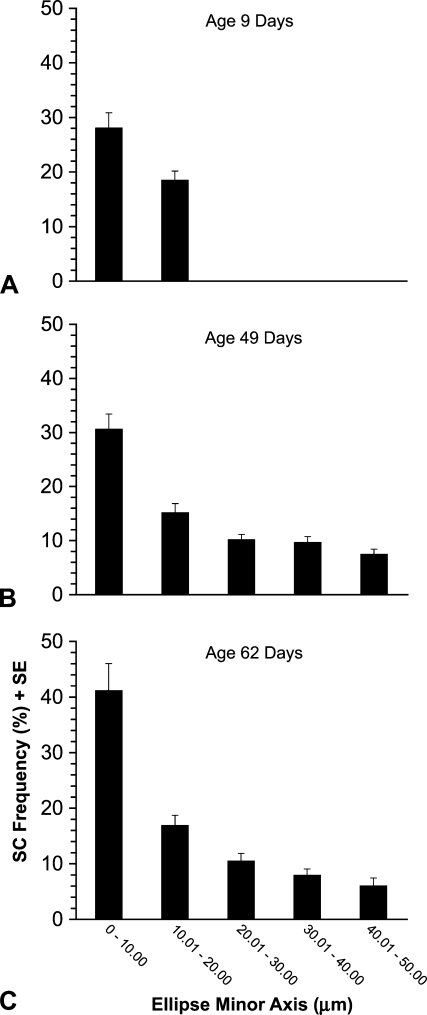
The main sites of longitudinal growth in skeletal muscle are the ends of the fibers. This study tests the hypothesis that satellite cells (SCs) are at a greater frequency (#SC nuclei/all nuclei within basal laminae) and concentration (closer together) within growing fiber ends of posthatch chicken pectoralis. SCs were localized by their Pax7 expression, and fiber ends were identified by their retention of neonatal myosin heavy chains and small cross-sectional profiles. Whereas SC frequency decreased from about 20% at 9 days posthatch to <5% at 115 days, fiber ends retained a frequency of approximately 16%. Calculated mean area of sarcolemma per SC revealed higher concentrations of SCs at fiber ends. There was also a strong inverse correlation between SC frequency and fiber profile cross-sectional size throughout development. This study suggests that SCs at fiber ends play a key role in the longitudinal growth of muscle fibers, and that fiber profile size may impact SC distribution.


Figures

Figure 1
Figure 1
Immunocytochemical labeling of serial cross-sections of developing chicken pectoralis. Muscles were from birds aged 9 (AC), 49 (DF), and 79 (GI) days posthatch. (A,D,G) Viewed by brightfield and labeled by the anti-neonatal MyHC antibody to distinguish the type of fiber profile (neonatal, n; transforming, t; adult, a). (B,E,H) Viewed under epifluorescence and sections are cut serially, respectively, to A,D,G. All nuclei appear blue due to labeling by Hoescht, and basal laminae appear red with labeling by anti-laminin. (C,F,I) Same sections as B,E,H, respectively, showing satellite cell (SC) nuclei in green labeled by anti-Pax7 and the basal laminae in red with anti-laminin.
Figure 2
Figure 2
Pax7+ nucleus outside the basal laminae. A cross-section prepared from pectoralis muscle of a 49-day-old chicken and labeled for immunofluorescence by Hoescht in blue (A), anti-Pax7 in green (B), and anti-laminin in red (A,B). Arrowheads indicate a Pax7+ nucleus located within the interstitial tissue of the muscle outside the basal laminae of the fibers.
Figure 3
Figure 3
Fiber profile size and SC frequency during development. Each symbol represents mean ± standard error (SE). (A) Mean frequency of SCs in the pectoralis was determined from at least 200 contiguous fiber profiles from the pectoralis of each of three chickens at each of the following ages: 9, 23, 30, 49, 62, 79, and 115 days posthatch. Frequency = (SCN/SCN + MN) − 100%, where SCN and MN are, respectively, the numbers of SC nuclei and myonuclei. SC frequency is significantly (p<0.01) decreased with age. (B) Mean fiber profile size, quantified by mean ellipse minor axis (in microns), was obtained using the same animals as in A. Fiber profile size is significantly (p<0.01) increased with age. (C) Linear regression showing a strong (r = −0.984, p<0.001) inverse correlation between mean SC frequency (A) and mean fiber profile size (B).
Figure 4
Figure 4
SC frequency and surface area of sarcolemma per SC during development in neonatal, transforming, and adult fiber profiles. (A) Each column represents mean SC frequency (%) ± SE. The frequency is significantly (p<0.001) greater in neonatal profiles than in either transforming or adult profiles. After 23 days of age, neonatal profiles are the ends of more mature transforming and adult profiles (Rosser et al. 2000). (B) Each column represents mean surface area of sarcolemma × 103 μm2 ± SE. There is significantly (p<0.05) less surface area per SC in neonatal profiles than in transforming or adult profiles.
Figure 5
Figure 5
SC frequency according to fiber profile size. Three birds were studied at each of three different ages: (A) 9 days, (B) 49 days, and (C) 62 days. Between 200 and 250 fiber profiles from each pectoralis studied were arranged into different groups according to their ellipse minor axes values. Each column represents mean SC frequency (%) ± SE. The frequency of SCs in ages 49 and 62 days is significantly (p<0.01) reduced with increasing fiber size. The smaller fiber profiles are the tapered ends of larger profiles (Rosser et al. 2000).

References

    1. Allen DL, Roy RR, Edgerton VR (1999) Myonuclear domains in muscle adaptation and disease. Muscle Nerve 22:1350–1360 - PubMed
    1. Allouh MZ, Rosser BWC (2006) Greater frequency and concentration of satellite cells at the ends of developing skeletal muscle fibers. FASEB J 20:A29 - PMC - PubMed
    1. Asakura A, Seale P, Girgis-Gabardo A, Rudniki MA (2002) Myogenic specification of side population cells in skeletal muscle. J Cell Biol 159:123–134 - PMC - PubMed
    1. Bandman E (1985) Continued expression of neonatal myosin heavy chain in adult dystrophic skeletal muscle. Science 227:780–782 - PubMed
    1. Bandman E, Rosser BWC (2000) Evolutionary significance of myosin heavy chain heterogeneity in birds. Microsc Res Tech 50:473–491 - PubMed

Publication types

Substances