

A biomonitoring study of lead, cadmium, and mercury in the blood of New York city adults
- PMID: 17938732
- PMCID: PMC2022653
- DOI: 10.1289/ehp.10056
A biomonitoring study of lead, cadmium, and mercury in the blood of New York city adults
Erratum in
-
Erratum: "A Biomonitoring Study of Lead, Cadmium, and Mercury in the Blood of New York City Adults".Environ Health Perspect. 2011 Feb 5;119(2):A57. doi: 10.1289/ehp.10056a. Environ Health Perspect. 2011. PMID: 29451377 Free PMC article.
Abstract
Objectives: We assessed the extent of exposure to lead, cadmium, and mercury in the New York City (NYC) adult population.
Methods: We measured blood metal concentrations in a representative sample of 1,811 NYC residents as part of the NYC Health and Nutrition Examination Survey, 2004.
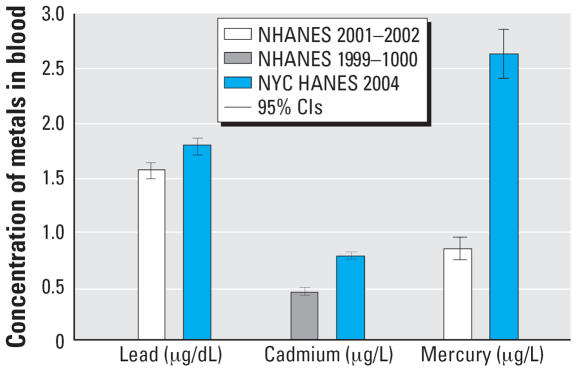
Results: The geometric mean blood mercury concentration was 2.73 microg/L [95% confidence interval (CI), 2.58-2.89]; blood lead concentration was 1.79 microg/dL (95% CI, 1.73-1.86); and blood cadmium concentration was 0.77 microg/L (95% CI, 0.75-0.80). Mercury levels were more than three times that of national levels. An estimated 24.8% (95% CI, 22.2-27.7%) of the NYC adult population had blood mercury concentration at or above the 5 microg/L New York State reportable level. Across racial/ethnic groups, the NYC Asian population, and the foreign-born Chinese in particular, had the highest concentrations of all three metals. Mercury levels were elevated 39% in the highest relative to the lowest income group (95% CI, 21-58%). Blood mercury concentrations in adults who reported consuming fish or shellfish 20 times or more in the last 30 days were 3.7 times the levels in those who reported no consumption (95% CI, 3.0-4.6); frequency of consumption explained some of the elevation in Asians and other subgroups.
Conclusions: Higher than national blood mercury exposure in NYC adults indicates a need to educate New Yorkers about how to choose fish and seafood to maximize health benefits while minimizing potential risks from exposure to mercury. Local biomonitoring can provide valuable information about environmental exposures.
Keywords: NYC HANES; biomonitoring; blood; cadmium; fish; lead; mercury; methylmercury; seafood; survey.
Figures
Similar articles
-
Tracking Declines in Mercury Exposure in the New York City Adult Population, 2004-2014.J Urban Health. 2018 Dec;95(6):813-825. doi: 10.1007/s11524-018-0269-z. J Urban Health. 2018. PMID: 30117056 Free PMC article.
-
Declines in adult blood lead levels in New York City compared with the United States, 2004-2014.Environ Res. 2018 May;163:194-200. doi: 10.1016/j.envres.2018.01.049. Epub 2018 Feb 22. Environ Res. 2018. PMID: 29454851
-
Population-based inorganic mercury biomonitoring and the identification of skin care products as a source of exposure in New York City.Environ Health Perspect. 2011 Feb;119(2):203-9. doi: 10.1289/ehp.1002396. Epub 2010 Oct 5. Environ Health Perspect. 2011. PMID: 20923743 Free PMC article.
-
Shellfish and residual chemical contaminants: hazards, monitoring, and health risk assessment along French coasts.Rev Environ Contam Toxicol. 2011;213:55-111. doi: 10.1007/978-1-4419-9860-6_3. Rev Environ Contam Toxicol. 2011. PMID: 21541848 Review.
-
Metal Concentrations in Newcomer Women and Environmental Exposures: A Scoping Review.Int J Environ Res Public Health. 2017 Mar 8;14(3):277. doi: 10.3390/ijerph14030277. Int J Environ Res Public Health. 2017. PMID: 28282863 Free PMC article.
Cited by
-
Biomarker Levels of Toxic Metals among Asian Populations in the United States: NHANES 2011-2012.Environ Health Perspect. 2017 Mar;125(3):306-313. doi: 10.1289/EHP27. Epub 2016 Aug 12. Environ Health Perspect. 2017. PMID: 27517362 Free PMC article.
-
National estimates of blood lead, cadmium, and mercury levels in the Korean general adult population.Int Arch Occup Environ Health. 2011 Jan;84(1):53-63. doi: 10.1007/s00420-010-0522-6. Epub 2010 Mar 3. Int Arch Occup Environ Health. 2011. PMID: 20198383
-
Regional and temporal trends in blood mercury concentrations and fish consumption in women of child bearing Age in the united states using NHANES data from 1999-2010.Environ Health. 2017 Feb 17;16(1):10. doi: 10.1186/s12940-017-0218-4. Environ Health. 2017. PMID: 28212649 Free PMC article.
-
High mercury seafood consumption associated with fatigue at specialty medical clinics on Long Island, NY.Prev Med Rep. 2015 Sep 25;2:798-802. doi: 10.1016/j.pmedr.2015.09.010. eCollection 2015. Prev Med Rep. 2015. PMID: 26844152 Free PMC article.
-
Balancing the benefits of n-3 polyunsaturated fatty acids and the risks of methylmercury exposure from fish consumption.Nutr Rev. 2011 Sep;69(9):493-508. doi: 10.1111/j.1753-4887.2011.00415.x. Nutr Rev. 2011. PMID: 21884130 Free PMC article. Review.
References
-
- Alfven T, Elinder CG, Carlsson MD, Grubb A, Hellstrom L, Persson B, et al. Low-level cadmium exposure and osteoporosis. J Bone Miner Res. 2000;15(8):1579–1586. - PubMed
-
- Andrews KW, Savitz DA, Hertz-Picciotto I. Prenatal lead exposure in relation to gestational age and birth weight: a review of epidemiologic studies. Am J Ind Med. 1994;26:13–32. - PubMed
-
- Annest JL, Pirkle JL, Makuc D, Neese JW, Bayse DD, Kovar MG. Chronological trend in blood lead levels between 1976 and 1980. N Engl J Med. 1983;308(23):1373–1377. - PubMed
Publication types
MeSH terms
Substances
Grants and funding
LinkOut - more resources
Full Text Sources
Medical
