. 2007 Oct 16:8:392.
doi: 10.1186/1471-2105-8-392.

Improved human disease candidate gene prioritization using mouse phenotype

Affiliations

Improved human disease candidate gene prioritization using mouse phenotype

Jing Chen et al. BMC Bioinformatics. .

Abstract

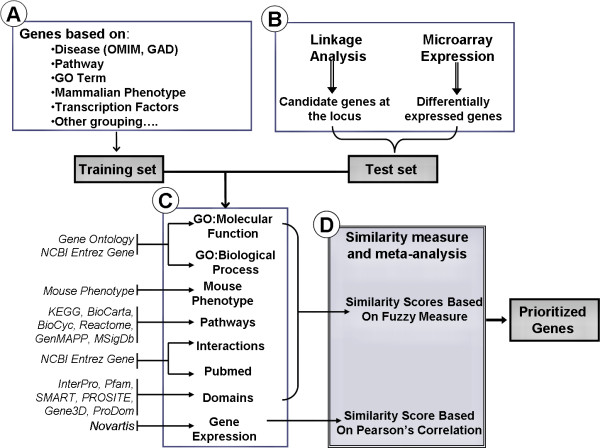
Background: The majority of common diseases are multi-factorial and modified by genetically and mechanistically complex polygenic interactions and environmental factors. High-throughput genome-wide studies like linkage analysis and gene expression profiling, tend to be most useful for classification and characterization but do not provide sufficient information to identify or prioritize specific disease causal genes.

Results: Extending on an earlier hypothesis that the majority of genes that impact or cause disease share membership in any of several functional relationships we, for the first time, show the utility of mouse phenotype data in human disease gene prioritization. We study the effect of different data integration methods, and based on the validation studies, we show that our approach, ToppGene http://toppgene.cchmc.org, outperforms two of the existing candidate gene prioritization methods, SUSPECTS and ENDEAVOUR.

Conclusion: The incorporation of phenotype information for mouse orthologs of human genes greatly improves the human disease candidate gene analysis and prioritization.


Figures

Figure 1
Figure 1
ROC curves of random-gene cross-validation based on score ranks. Blue curve was generated from the 19 disease gene training sets. Black curve, negative control, was generated from 20 random training sets. See text for the definitions of sensitivity and specificity.
Figure 2
Figure 2
AUC of different feature sets. Red bars indicate the AUC scores based on each feature set, and blue bars are the corresponding random controls. Yellow bars indicate the coverage of each feature set in the whole genome. For example, mouse phenotype (MP) has AUC score 0.78 and covers 19% of genes in the whole genome. For each feature set, the ROC curve was generated using genes with annotations only.
Figure 3
Figure 3
ROC curves of random-gene cross-validation based on scores. The red curve was generated using all features sets (AUC score 0.913). The blue curve was generated without Mouse Phenotype annotations (AUC score 0.893). The orange curve was generated without Mouse Phenotype and Pubmed annotations (AUC score 0.888). See text for the definitions of sensitivity and specificity.
Figure 4
Figure 4
The performance of locus-region cross-validation using different feature sets. The average rank ratio (y-axis on the left) indicates the average rank ratio of the "target" genes in the resulting list, thus lower value corresponding to a better performance. At the same time, the higher the number of top 5% ranked "target" genes among total of 150 prioritizations (y-axis on the right), the better the performance. As a result, it's very clear that removing MP, PubMed or both resulted in significant drop of performance.
Figure 5
Figure 5
Schematic representation of gene prioritization. (A) Genes in the training set are selected based on their attributes or current gene annotations (genes associated with a disease, phenotype, pathway or a GO term). (B) Test gene source can be candidate genes from linkage analysis studies or genes differentially expressed in a particular disease or phenotype. (C) Enriched terms of the eight gene annotations, namely, GO: Molecular Function, GO: Biological Process, Mouse Phenotype, Pathways, Protein Interactions, Protein Domains and Gene Expression, compiled from various data sources, are obtained for the training set of genes. (D) A similarity score is generated for each annotation of each test gene by comparing to the enriched terms in the training set of genes. The final prioritized gene list is then computed based on the aggregated values of the eight similarity scores.

Similar articles

Cited by

References

    1. Giallourakis C, Henson C, Reich M, Xie X, Mootha VK. Disease gene discovery through integrative genomics. Annu Rev Genomics Hum Genet. 2005;6:381–406. doi: 10.1146/annurev.genom.6.080604.162234. - DOI - PubMed
    1. Dennis G, Jr., Sherman BT, Hosack DA, Yang J, Gao W, Lane HC, Lempicki RA. DAVID: Database for Annotation, Visualization, and Integrated Discovery. Genome Biol. 2003;4:P3. doi: 10.1186/gb-2003-4-5-p3. - DOI - PubMed
    1. Subramanian A, Tamayo P, Mootha VK, Mukherjee S, Ebert BL, Gillette MA, Paulovich A, Pomeroy SL, Golub TR, Lander ES, Mesirov JP. Gene set enrichment analysis: a knowledge-based approach for interpreting genome-wide expression profiles. Proc Natl Acad Sci U S A. 2005;102:15545–15550. doi: 10.1073/pnas.0506580102. - DOI - PMC - PubMed
    1. Al-Shahrour F, Diaz-Uriarte R, Dopazo J. FatiGO: a web tool for finding significant associations of Gene Ontology terms with groups of genes. Bioinformatics. 2004;20:578–580. doi: 10.1093/bioinformatics/btg455. - DOI - PubMed
    1. Freudenberg J, Propping P. A similarity-based method for genome-wide prediction of disease-relevant human genes. Bioinformatics. 2002;18 Suppl 2:S110–5. - PubMed

Publication types