. 2007 Dec;6(12):2212-29.
doi: 10.1074/mcp.M700354-MCP200. Epub 2007 Oct 15.

Quantitative, multiplexed assays for low abundance proteins in plasma by targeted mass spectrometry and stable isotope dilution

Affiliations

Quantitative, multiplexed assays for low abundance proteins in plasma by targeted mass spectrometry and stable isotope dilution

Hasmik Keshishian et al. Mol Cell Proteomics. 2007 Dec.

Abstract

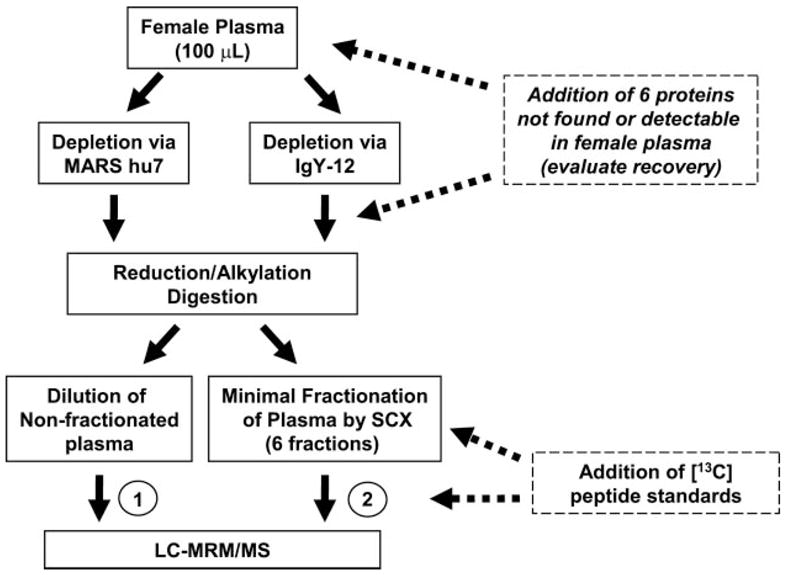
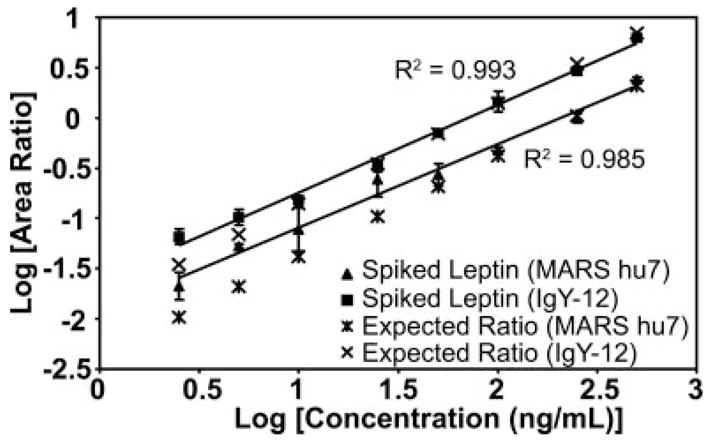
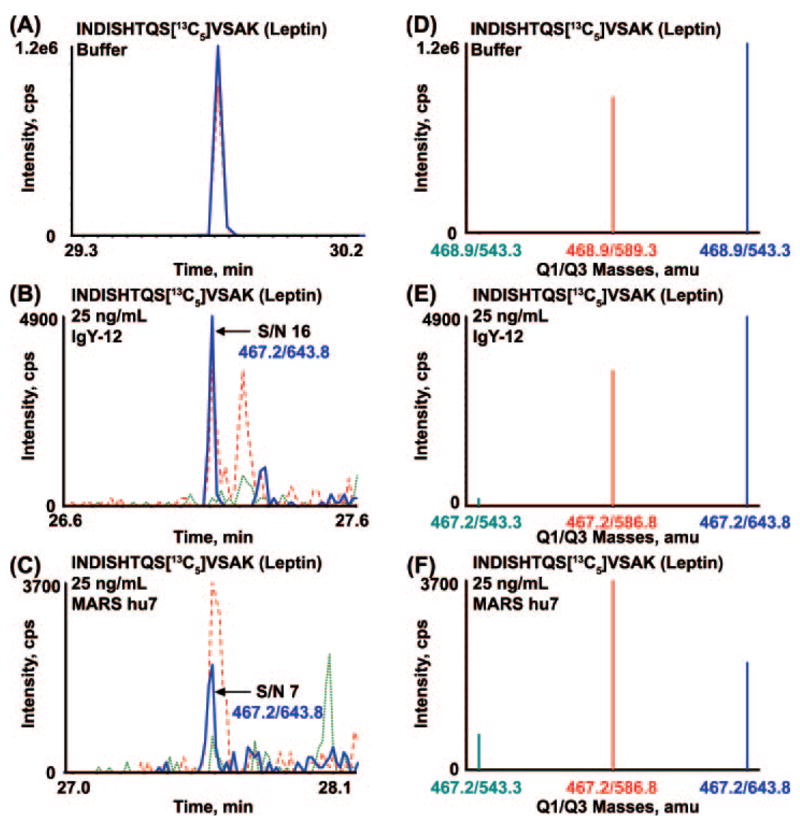
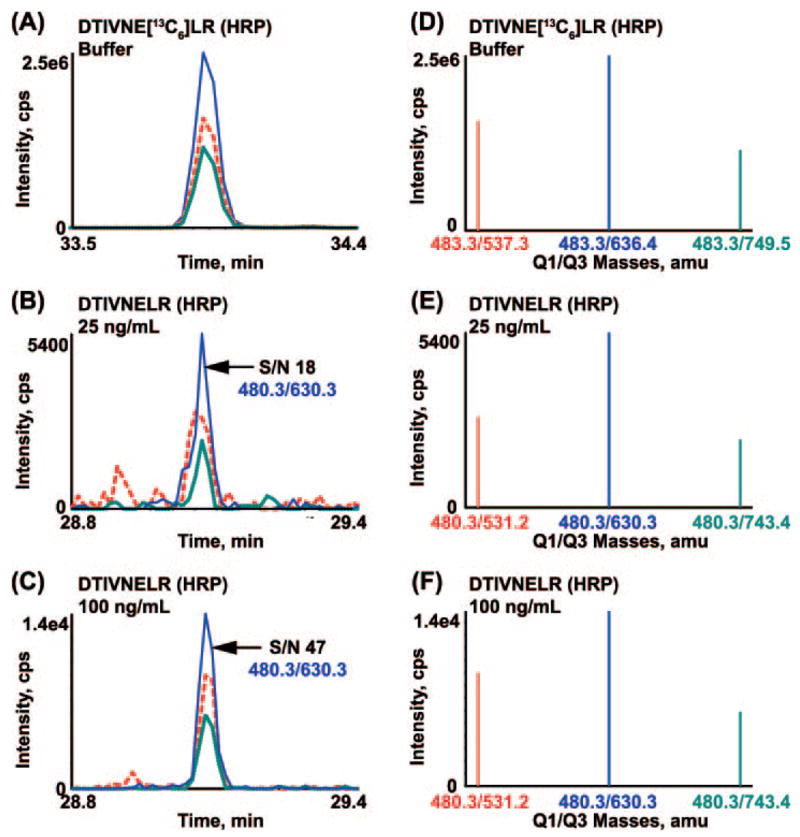
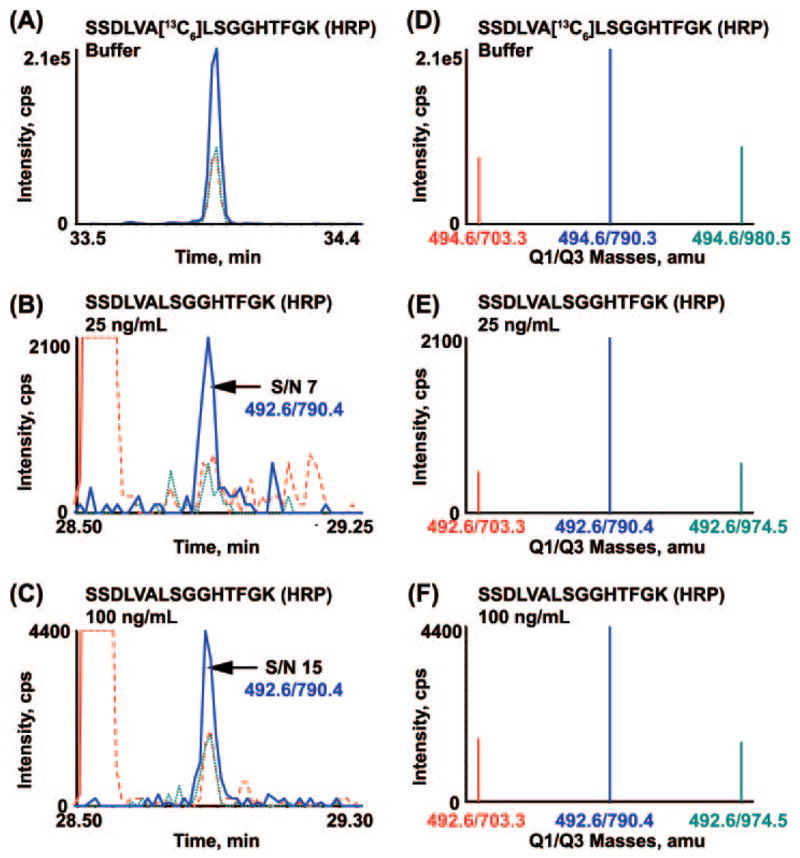
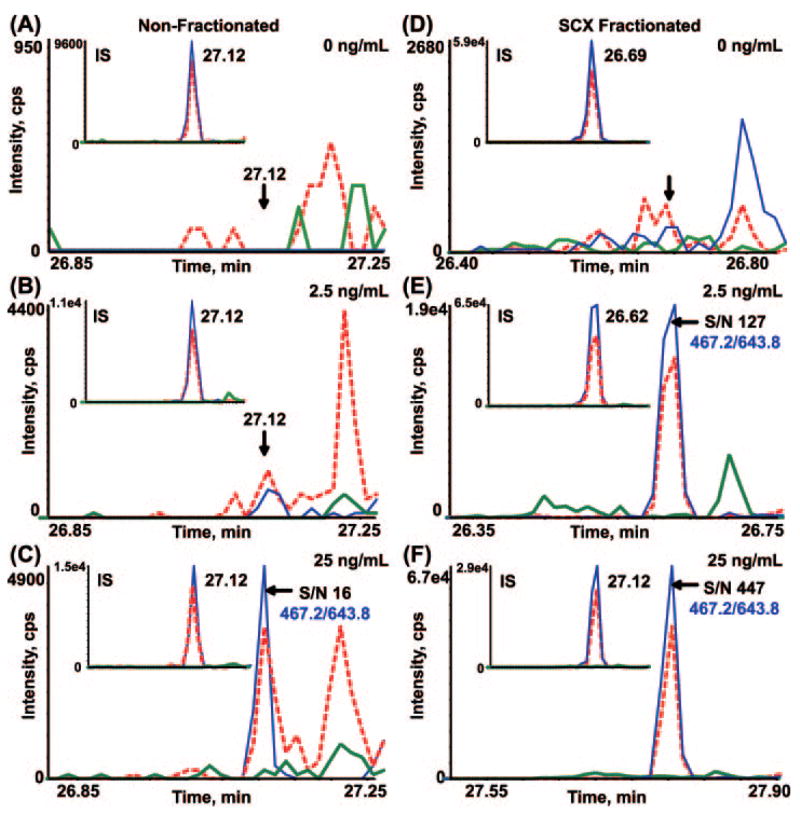
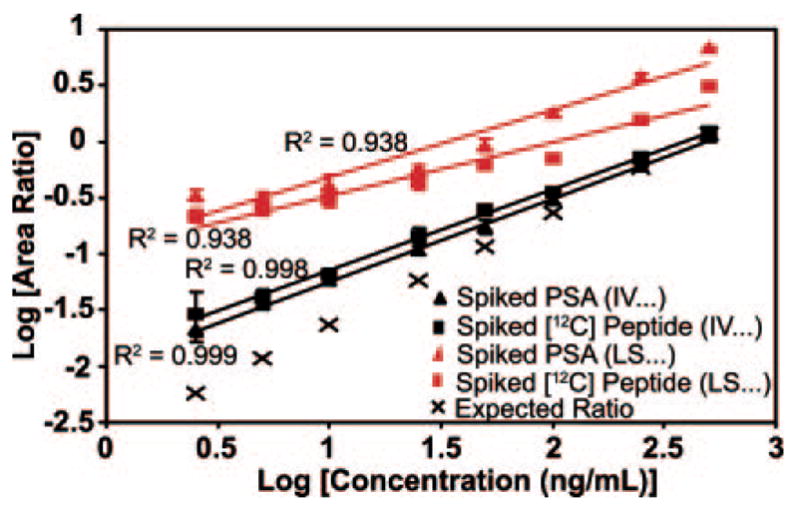
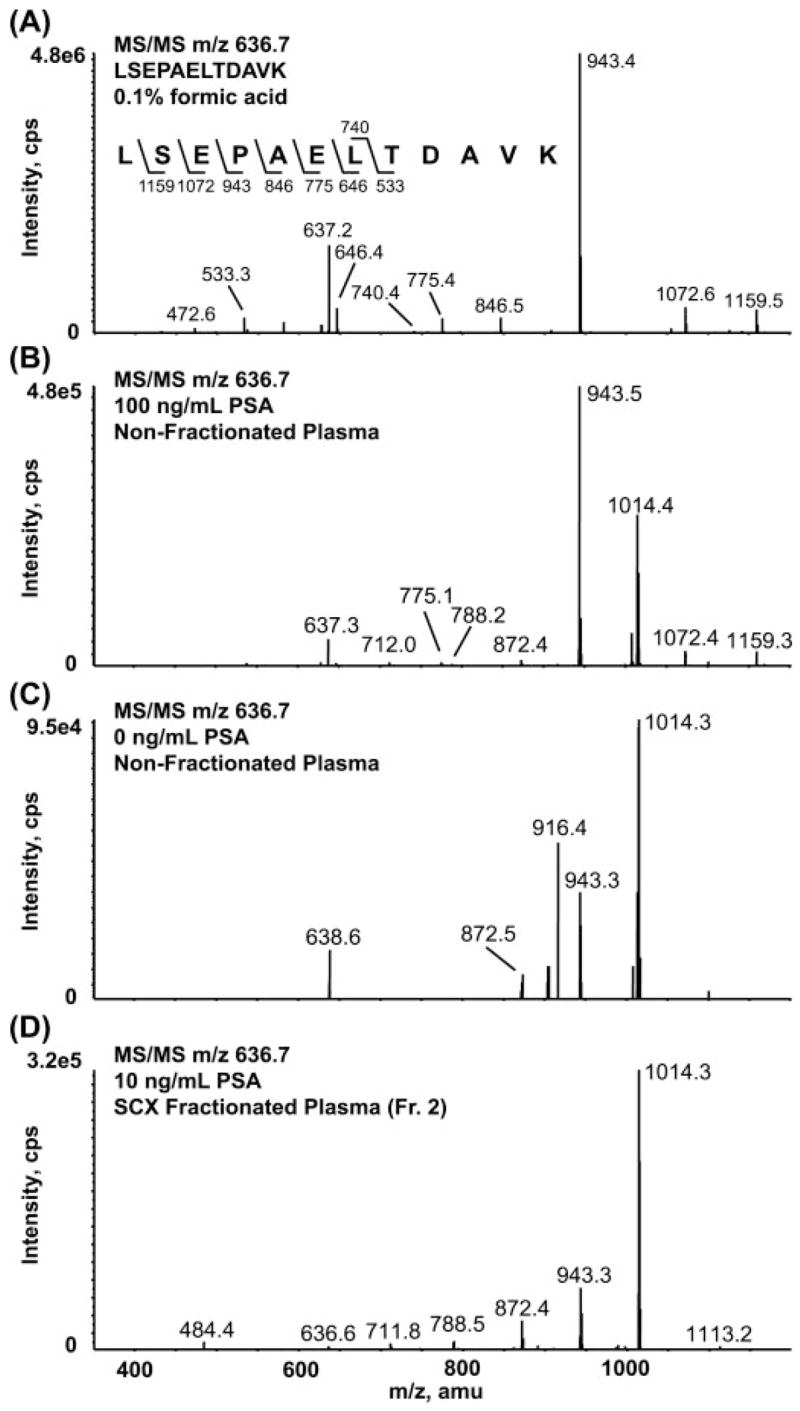
Biomarker discovery produces lists of candidate markers whose presence and level must be subsequently verified in serum or plasma. Verification represents a paradigm shift from unbiased discovery approaches to targeted, hypothesis-driven methods and relies upon specific, quantitative assays optimized for the selective detection of target proteins. Many protein biomarkers of clinical currency are present at or below the nanogram/milliliter range in plasma and have been inaccessible to date by MS-based methods. Using multiple reaction monitoring coupled with stable isotope dilution mass spectrometry, we describe here the development of quantitative, multiplexed assays for six proteins in plasma that achieve limits of quantitation in the 1-10 ng/ml range with percent coefficients of variation from 3 to 15% without immunoaffinity enrichment of either proteins or peptides. Sample processing methods with sufficient throughput, recovery, and reproducibility to enable robust detection and quantitation of candidate biomarker proteins were developed and optimized by addition of exogenous proteins to immunoaffinity depleted plasma from a healthy donor. Quantitative multiple reaction monitoring assays were designed and optimized for signature peptides derived from the test proteins. Based upon calibration curves using known concentrations of spiked protein in plasma, we determined that each target protein had at least one signature peptide with a limit of quantitation in the 1-10 ng/ml range and linearity typically over 2 orders of magnitude in the measurement range of interest. Limits of detection were frequently in the high picogram/milliliter range. These levels of assay performance represent up to a 1000-fold improvement compared with direct analysis of proteins in plasma by MS and were achieved by simple, robust sample processing involving abundant protein depletion and minimal fractionation by strong cation exchange chromatography at the peptide level prior to LC-multiple reaction monitoring/MS. The methods presented here provide a solid basis for developing quantitative MS-based assays of low level proteins in blood.


Figures

Fig. 1
Fig. 1. Experimental flow diagram for LOQ studies
Female plasma from a healthy donor was immunoaffinity depleted of 7 and 12 high abundance proteins via commercial affinity columns. Proteins listed in Table I were added to depleted plasma at 0, 2.5, 5, 10, 25, 50, 100, 250, and 500 ng/ml prior to reduction, alkylation, and digestion. Two separate processing paths were followed after proteolytic digestion. In path 1 (left), digested plasma was diluted to yield ≤1 μg of total protein on column, and internal standards were added just prior to LC-MRM/MS. In path 2 (right), peptides were separated by SCX, and internal standards were added to corresponding SCX pooled fractions prior to LC-MRM/MS. All MRM analyses were performed in triplicate.
Fig. 2
Fig. 2. Calibration curve for quantifying mouse leptin in MARS hu7 and IgY-12 depleted plasma
The area ratio of light peptide to heavy peptide was determined from the extracted ion chromatograms of the 467.2/643.8 and 468.9/646.3 transitions, respectively, and plotted versus protein concentration. Three biological replicates for each concentration point were generated in MARS hu7 (closed triangle) and IgY-12 (closed square) depleted plasma and analyzed in triplicate by MRM (n = 9). Error bars indicate S.D. of the measurements. Raw data are shown in Fig. 3.
Fig. 3
Fig. 3. Extracted ion chromatograms (A–C) and MRM spectra (D–F) of transitions monitored for mouse leptin in buffer (A and D), IgY-12 (B and E), and MARS hu7 (C and F) depleted plasma
Overlay of XICs and the corresponding MRM spectra for the three transitions monitored for INDISH-TQSVSAK peptide of leptin in 0.1% formic acid (A and D) and the same peptide produced by digestion of leptin protein that had been spiked at 25 ng/ml into IgY-12 depleted plasma (B and E) and into MARS hu7 depleted plasma (C and F). XICs and ions in the MRM/MS spectra are color-coordinated. cps, counts/s.
Fig. 4
Fig. 4. Extracted ion chromatograms (A–C) and MRM spectra (D–F) of transitions monitored for DTIVN-ELR derived from HRP in nonfractionated, depleted plasma
Overlay of XICs and the corresponding MRM spectra for the three transitions monitored for DTIVNELR peptide of HRP in 0.1% formic acid (A and D) and the same peptide produced by digestion of HRP protein that had been spiked at 25 (B and E) or 100 ng/ml (C and F) into IgY-12 depleted plasma. XICs and ions in the MRM/MS spectra are color-coordinated. cps, counts/s.
Fig. 5
Fig. 5. Extracted ion chromatograms (A–C) and MRM spectra (D–F) of transitions monitored for SS-DLVALSGGHTFGK derived from HRP in nonfractionated, depleted plasma
Overlay of XICs and the corresponding MRM spectra for the three transitions monitored for SSDLVALSGGHTFGK peptide of HRP in 0.1% formic acid (A and D) and the same peptide produced by digestion of HRP protein that had been spiked at 25 (B and E) or 100 ng/ml (C and F) into IgY-12 depleted plasma. XICs and ions in the MRM/MS spectra are color-coordinated. cps, counts/s.
Fig. 6
Fig. 6. Extracted ion chromatograms of MRM transitions monitored for the INDISHTQSVSAK peptide derived from mouse leptin in nonfractionated (A–C) and SCX-fractionated (D–F), depleted plasma
Each XIC displays an overlay of three MRM transitions being monitored for the INDISH-TQSVSAK peptide (467.2/543.3 (green), 467.2/586.8 (red), and 467.2/643.8 (blue). Each inset XIC displays the MRM transitions for the internal standard peptide, indicating retention time for the analyte peptide. The 467.2/643.8 transition (blue) was used for quantification. Overlay of MRM transitions for leptin spiked into depleted, nonfractionated plasma at 0 (A), 2.5 (B), and 25 ng/ml (C) is shown. Overlay of MRM transitions for leptin spiked into depleted plasma followed by SCX fractionation at 0 (D), 2.5 (E), and 25 ng/ml (F) is shown. The S/N at 2.5 and 25 ng/ml was 127 and 447, respectively. cps, counts/s.
Fig. 7
Fig. 7. Protein and 12C-synthetic peptide calibration curves for quantifying human PSA in nonfractionated, depleted plasma
Calibration curves were generated with intact PSA added to depleted plasma prior to digestion and with 12C-synthetic peptides added to digested, depleted plasma. Two peptides, IVGGWECamcEK and LSE-PAELTDAVK, were used to quantify PSA by using the area ratio of light peptide to heavy peptide from the XICs of the 539.3/865.4 and 636.7/943.4 transitions, respectively. The concentration of 12C-peptide added was equivalent to the concentration of intact protein added. Three biological replicates for each concentration point were generated with intact PSA, whereas the calibration curves with 12C-synthetic peptides were generated once. Each point for all curves was analyzed in triplicate by MRM. Error bars indicate S.D. of the measurements.
Fig. 8
Fig. 8. Full scan MS/MS spectra recorded on the doubly charged ion at m/z 636.7
A, 12C-synthetic peptide LSEPAELTDAVK in 0.1% formic acid. B, 100 ng/ml spike of PSA in nonfractionated, depleted plasma. C, 0 ng/ml sample where no analyte protein or peptide was added. D, 10 ng/ml spike of PSA in SCX-fractionated, depleted plasma. The sequence-specific fragment ion at m/z 943.4 (y9) for the LSEPAELTDAVK peptide derived from PSA is observed in the 0 ng/ml sample (C), representing an interfering component in this channel from the matrix that limits the usefulness of this peptide for quantifying PSA in nonfractionated plasma. Fr., fraction; cps, counts/s.

References

    1. Aebersold R, Mann M. Mass spectrometry-based proteomics. Nature. 2003;422:198–207. - PubMed
    1. Adkins JN, Varnum SM, Auberry KJ, Moore RJ, Angell NH, Smith RD, Springer DL, Pounds JG. Toward a human blood serum proteome: analysis by multidimensional separation coupled with mass spectrometry. Mol Cell Proteomics. 2002;1:947–955. - PubMed
    1. Rifai N, Gillette MA, Carr SA. Protein biomarker discovery and validation: the long and uncertain path to clinical utility. Nat Biotechnol. 2006;16:1929–1935. - PubMed
    1. Wang W, Zhou H, Lin H, Roy S, Shaler TA, Hill LR, Norton S, Kumar P, Anderle M, Becker CH. Quantification of proteins and metabolites by mass spectrometry without isotopic labeling or spiked standards. Anal Chem. 2003;75:4818–4826. - PubMed
    1. MacCoss MJ, Wu CC, Liu H, Sadygov R, Yates JR., III A correlation algorithm for the automated quantitative analysis of shotgun proteomics data. Anal Chem. 2003;75:6912–6921. - PubMed

Publication types

LinkOut - more resources