. 2007 Oct 23;104(43):16886-91.
doi: 10.1073/pnas.0708365104. Epub 2007 Oct 16.

Cyclic changes in metabolic state during the life of a yeast cell

Affiliations

Cyclic changes in metabolic state during the life of a yeast cell

Benjamin P Tu et al. Proc Natl Acad Sci U S A. .

Abstract

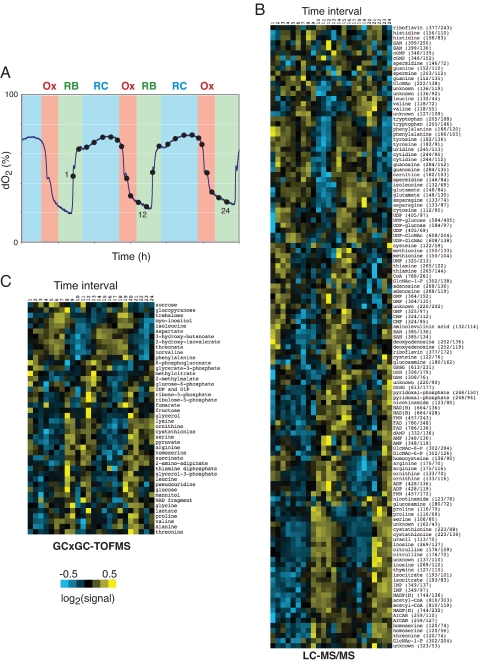
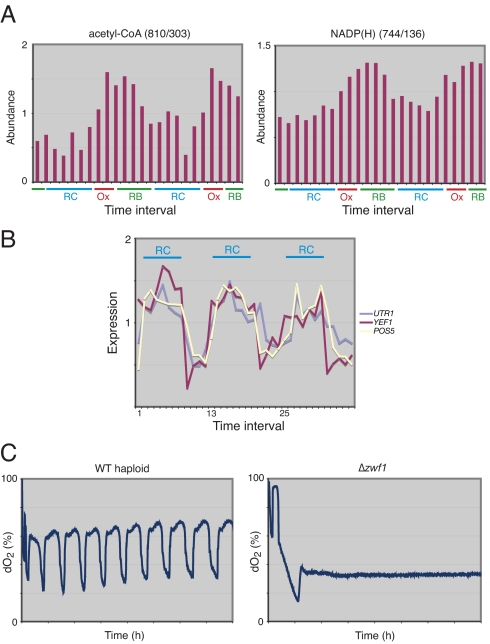
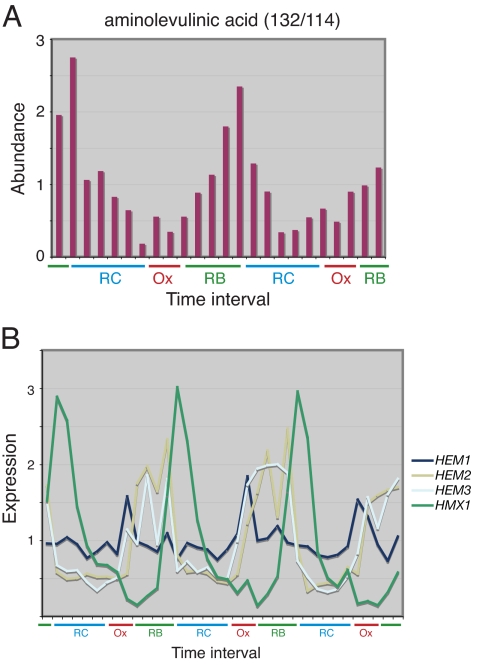
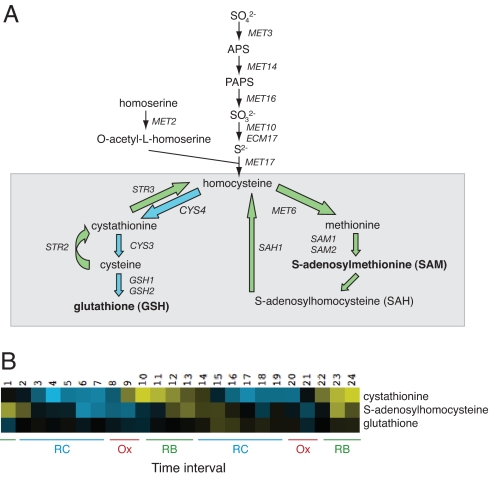
Budding yeast undergo robust oscillations in oxygen consumption during continuous growth in a nutrient-limited environment. Using liquid chromatography-mass spectrometry and comprehensive 2D gas chromatography-mass spectrometry-based metabolite profiling methods, we have determined that the intracellular concentrations of many metabolites change periodically as a function of these metabolic cycles. These results reveal the logic of cellular metabolism during different phases of the life of a yeast cell. They may further indicate that oscillation in the abundance of key metabolites might help control the temporal regulation of cellular processes and the establishment of a cycle. Such oscillations in metabolic state might occur during the course of other biological cycles.


Conflict of interest statement

The authors declare no conflict of interest.

Figures

Fig. 1.
Fig. 1.
Cyclic changes in metabolic state during the YMC. (A) The YMC. Shown are several metabolic cycles exhibited by a WT diploid strain and intervals of the dissolved oxygen trace that correspond to the Ox, RB, and RC phases. Intracellular metabolites were extracted for LC-MS/MS analysis at the 24 time points indicated (dots). For GC×GC-TOFMS sampling time points (which are similar to those for LC-MS/MS but not the same), see SI Appendix. x-axis tick marks denote 2-h intervals. (B) Hierarchical clustering analysis of metabolite profiles obtained from LC-MS/MS analysis. Rows correspond to metabolites (parent ion mass/daughter ion mass), and columns correspond to 24 time intervals over two consecutive metabolic cycles as depicted in A. Metabolite data were log2-transformed, centered about the mean, normalized, and clustered by using Spearman–Rank correlation (36). (C) Hierarchical clustering analysis of metabolite profiles obtained from GC×GC-TOFMS analysis. Shown are the ≈40 metabolites identified to have robust oscillations (>1.5-fold amplitude) in concentration. Metabolite data were log2-transformed, centered about the mean, normalized, and clustered by using Spearman–Rank correlation (36). For a heat map of the data, which shows more depth of modulation, see SI Appendix.
Fig. 2.
Fig. 2.
Acetyl-CoA and NADP(H) levels are highly periodic during the YMC. (A) Acetyl-CoA and NADP(H) concentrations over two consecutive metabolic cycles. Note that both acetyl-CoA and total NADP(H) periodically increase in concentration at the end of the RC phase and into the Ox phase. (B) Temporal expression profiles of the three NAD(H) kinases in yeast. Expression data are from ref. . (C) Cells lacking glucose-6-phosphate dehydrogenase (Δzwf1, which cannot use the pentose phosphate pathway to synthesize NADPH) do not exhibit metabolic cycles during continuous growth. Shown is the dissolved oxygen trace of a WT and Δzwf1 strain for ≈40 h after the start of continuous mode. x-axis tick marks denote 5-h time intervals.
Fig. 3.
Fig. 3.
Cycles of heme synthesis during the YMC. (A) ALA levels oscillate with a large amplitude during the YMC. Note that ALA levels begin to increase as cells exit Ox phase and enter RB phase. (B) Temporal expression profiles of genes encoding enzymes of the heme pathway during the YMC. Note that HEM1 transcript levels are highest in Ox phase just before the observed increase in ALA concentration. HEM2 and HEM3 transcript levels peak shortly after HEM1. The gene encoding heme oxygenase (HMX1) is up-regulated strongly in the RC phase. Expression data are from ref. .
Fig. 4.
Fig. 4.
Sulfur metabolism in budding yeast. (A) Diagram of the sulfur metabolism pathway in budding yeast. Note that homocysteine lies at a critical juncture between two branches of the pathway. The GSH branch (blue arrows) is dedicated to the biosynthesis of cysteine and GSH, and the SAM branch (green arrows) is dedicated to the biosynthesis of methionine and SAM. (B) Several sulfur metabolites are highly periodic as a function of the YMC. Cystathionine, SAH, and GSH levels are all periodic and peak at slightly different time intervals of the YMC. Note that cystathionine peaks during the Ox and RB phases distinctly before SAH.
Fig. 5.
Fig. 5.
The logic of sulfur metabolism during the YMC. (A) Temporal expression profiles of sulfur metabolism pathway genes. Note that STR2 and STR3 are clearly up-regulated at the end of the RC phase before the other genes in the pathway, revealing a dynamic switch to the SAM branch of the pathway during RB phase. In the RC phase, sulfur flux is directed back to the GSH branch. Expression data are from ref. . (B) A cys4 mutant cannot undergo the YMC. Cells containing a disruption in the 3′ UTR of cystathionine β-synthase (CYS4) do not exhibit metabolic cycles during continuous growth. Shown is the dissolved oxygen trace of a cys4 mutant for ≈22 h after the start of continuous mode. x-axis tick marks correspond to 5-h intervals. Mutations in human cystathionine β-synthase have been linked to various disorders of the brain.

Similar articles

Cited by

References

    1. Lowrey PL, Takahashi JS. Annu Rev Genomics Hum Genet. 2004;5:407–441. - PMC - PubMed
    1. Wijnen H, Young MW. Annu Rev Genet. 2006;40:409–448. - PubMed
    1. Harmer SL, Hogenesch JB, Straume M, Chang HS, Han B, Zhu T, Wang X, Kreps JA, Kay SA. Science. 2000;290:2110–2113. - PubMed
    1. Claridge-Chang A, Wijnen H, Naef F, Boothroyd C, Rajewsky N, Young MW. Neuron. 2001;32:657–671. - PubMed
    1. McDonald MJ, Rosbash M. Cell. 2001;107:567–578. - PubMed

Publication types

LinkOut - more resources