

Neural correlates of a postponed decision report
- PMID: 17940014
- PMCID: PMC2040441
- DOI: 10.1073/pnas.0707961104
Neural correlates of a postponed decision report
Abstract
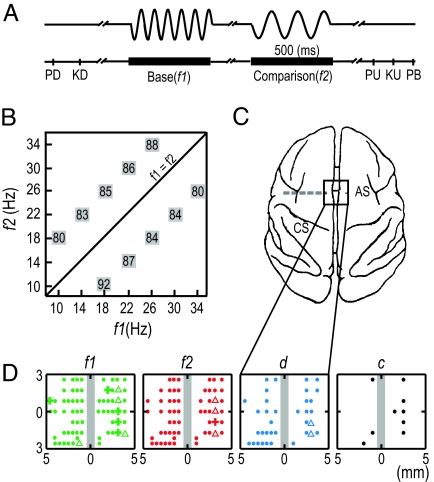
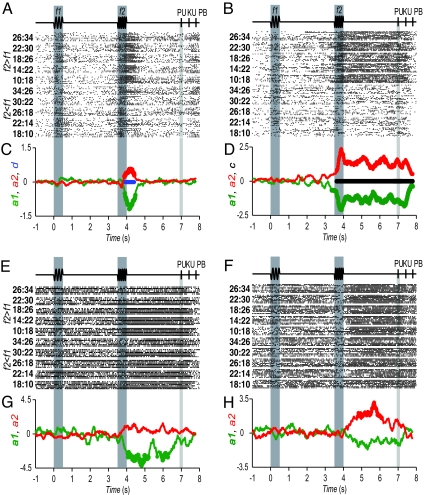
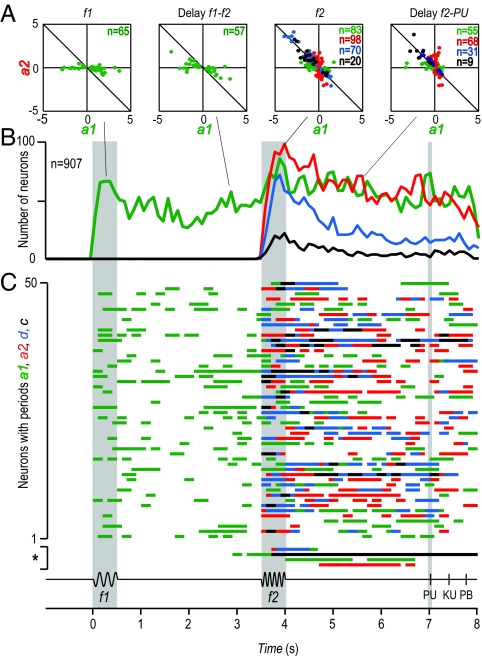
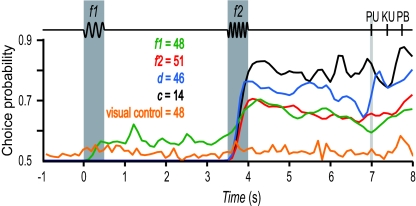
Depending on environmental demands, a decision based on a sensory evaluation may be either immediately reported or postponed for later report. If postponed, the decision must be held in memory. But what exactly is stored by the underlying memory circuits, the final decision itself or the sensory information that led to it? Here, we report that, during a postponed decision report period, the activity of medial premotor cortex neurons encodes both the result of the sensory evaluation that corresponds to the monkey's possible choices and past sensory information on which the decision is based. These responses could switch back and forth with remarkable flexibility across the postponed decision report period. Moreover, these responses covaried with the animal's decision report. We propose that maintaining in working memory the original stimulus information on which the decision is based could serve to continuously update the postponed decision report in this task.
Conflict of interest statement
The authors declare no conflict of interest.
Figures
Similar articles
-
Task-driven intra- and interarea communications in primate cerebral cortex.Proc Natl Acad Sci U S A. 2015 Apr 14;112(15):4761-6. doi: 10.1073/pnas.1503937112. Epub 2015 Mar 30. Proc Natl Acad Sci U S A. 2015. PMID: 25825731 Free PMC article.
-
Decoding a perceptual decision process across cortex.Neuron. 2010 Apr 29;66(2):300-14. doi: 10.1016/j.neuron.2010.03.031. Neuron. 2010. PMID: 20435005
-
Comparison of Decision-Related Signals in Sensory and Motor Preparatory Responses of Neurons in Area LIP.J Neurosci. 2018 Jul 11;38(28):6350-6365. doi: 10.1523/JNEUROSCI.0668-18.2018. Epub 2018 Jun 13. J Neurosci. 2018. PMID: 29899029 Free PMC article.
-
Analysing neuronal correlates of the comparison of two sequentially presented sensory stimuli.Philos Trans R Soc Lond B Biol Sci. 2002 Dec 29;357(1428):1843-50. doi: 10.1098/rstb.2002.1167. Philos Trans R Soc Lond B Biol Sci. 2002. PMID: 12626017 Free PMC article. Review.
-
Decision-making, behavioral supervision and learning: an executive role for the ventral premotor cortex?Neurotox Res. 2010 Nov;18(3-4):416-27. doi: 10.1007/s12640-010-9194-y. Epub 2010 Apr 20. Neurotox Res. 2010. PMID: 20405351 Review.
Cited by
-
Decision making in recurrent neuronal circuits.Neuron. 2008 Oct 23;60(2):215-34. doi: 10.1016/j.neuron.2008.09.034. Neuron. 2008. PMID: 18957215 Free PMC article. Review.
-
Dynamics of neural population responses in prefrontal cortex indicate changes of mind on single trials.Curr Biol. 2014 Jul 7;24(13):1542-7. doi: 10.1016/j.cub.2014.05.049. Epub 2014 Jun 19. Curr Biol. 2014. PMID: 24954050 Free PMC article.
-
Neural encoding of auditory discrimination in ventral premotor cortex.Proc Natl Acad Sci U S A. 2009 Aug 25;106(34):14640-5. doi: 10.1073/pnas.0907505106. Epub 2009 Aug 10. Proc Natl Acad Sci U S A. 2009. PMID: 19667191 Free PMC article.
-
Neural Decoding Reveals Concurrent Phonemic and Subphonemic Representations of Speech Across Tasks.Neurobiol Lang (Camb). 2021 May 7;2(2):254-279. doi: 10.1162/nol_a_00034. eCollection 2021 May. Neurobiol Lang (Camb). 2021. PMID: 34396148 Free PMC article.
-
Task-driven intra- and interarea communications in primate cerebral cortex.Proc Natl Acad Sci U S A. 2015 Apr 14;112(15):4761-6. doi: 10.1073/pnas.1503937112. Epub 2015 Mar 30. Proc Natl Acad Sci U S A. 2015. PMID: 25825731 Free PMC article.
References
-
- Newsome WT, Britten KH, Movshon JA. Nature. 1989;341:52–54. - PubMed
-
- Salzman CD, Britten KH, Newsome WT. Nature. 1990;346:174–177. - PubMed
-
- Romo R, Hernández A, Zainos A, Salinas E. Nature. 1998;392:387–390. - PubMed
-
- Romo R, Hernández A, Zainos A, Brody CD, Lemus L. Neuron. 2000;26:273–278. - PubMed
Publication types
MeSH terms
LinkOut - more resources
Full Text Sources
Miscellaneous
