

Structure and dynamics of a ribosome-bound nascent chain by NMR spectroscopy
- PMID: 17940046
- PMCID: PMC2034214
- DOI: 10.1073/pnas.0704664104
Structure and dynamics of a ribosome-bound nascent chain by NMR spectroscopy
Abstract
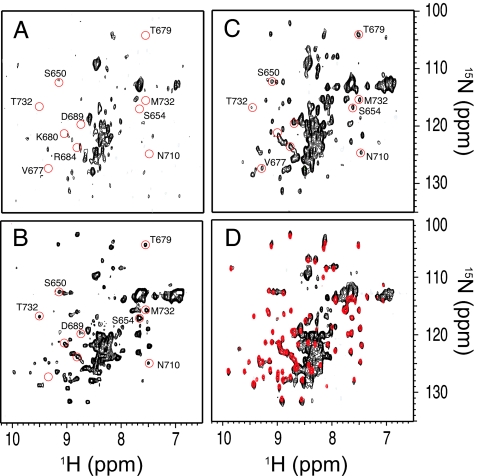
Protein folding in living cells is inherently coupled to protein synthesis and chain elongation. There is considerable evidence that some nascent chains fold into their native structures in a cotranslational manner before release from the ribosome, but, despite its importance, a detailed description of such a process at the atomic level remains elusive. We show here at a residue-specific level that a nascent protein chain can reach its native tertiary structure on the ribosome. By generating translation-arrested ribosomes in which the newly synthesized polypeptide chain is selectively (13)C/(15)N-labeled, we observe, using ultrafast NMR techniques, a large number of resonances of a ribosome-bound nascent chain complex corresponding to a pair of C-terminally truncated immunoglobulin (Ig) domains. Analysis of these spectra reveals that the nascent chain adopts a structure in which a native-like N-terminal Ig domain is tethered to the ribosome by a largely unfolded and highly flexible C-terminal domain. Selective broadening of resonances for a group of residues that are colocalized in the structure demonstrates that there are specific but transient interactions between the ribosome and the N-terminal region of the folded Ig domain. These findings represent a step toward a detailed structural understanding of the cellular processes of cotranslational folding.
Conflict of interest statement
The authors declare no conflict of interest.
Figures


Similar articles
-
A structural ensemble of a ribosome-nascent chain complex during cotranslational protein folding.Nat Struct Mol Biol. 2016 Apr;23(4):278-285. doi: 10.1038/nsmb.3182. Epub 2016 Feb 29. Nat Struct Mol Biol. 2016. PMID: 26926436 Free PMC article.
-
Probing side-chain dynamics of a ribosome-bound nascent chain using methyl NMR spectroscopy.J Am Chem Soc. 2009 Jun 24;131(24):8366-7. doi: 10.1021/ja902778n. J Am Chem Soc. 2009. PMID: 19492839
-
Cotranslational structure acquisition of nascent polypeptides monitored by NMR spectroscopy.Proc Natl Acad Sci U S A. 2010 May 18;107(20):9111-6. doi: 10.1073/pnas.0914300107. Epub 2010 May 3. Proc Natl Acad Sci U S A. 2010. PMID: 20439768 Free PMC article.
-
Protein folding on the ribosome studied using NMR spectroscopy.Prog Nucl Magn Reson Spectrosc. 2013 Oct;74(100):57-75. doi: 10.1016/j.pnmrs.2013.07.003. Epub 2013 Jul 27. Prog Nucl Magn Reson Spectrosc. 2013. PMID: 24083462 Free PMC article. Review.
-
Folding at the birth of the nascent chain: coordinating translation with co-translational folding.Curr Opin Struct Biol. 2011 Feb;21(1):25-31. doi: 10.1016/j.sbi.2010.10.008. Epub 2010 Nov 24. Curr Opin Struct Biol. 2011. PMID: 21111607 Review.
Cited by
-
Translatomics: The Global View of Translation.Int J Mol Sci. 2019 Jan 8;20(1):212. doi: 10.3390/ijms20010212. Int J Mol Sci. 2019. PMID: 30626072 Free PMC article. Review.
-
Conjugation with polyamines enhances the antibacterial and anticancer activity of chloramphenicol.Nucleic Acids Res. 2014 Jul;42(13):8621-34. doi: 10.1093/nar/gku539. Epub 2014 Jun 17. Nucleic Acids Res. 2014. PMID: 24939899 Free PMC article.
-
Chain dynamics of nascent polypeptides emerging from the ribosome.ACS Chem Biol. 2008 Sep 19;3(9):555-66. doi: 10.1021/cb800059u. Epub 2008 Aug 22. ACS Chem Biol. 2008. PMID: 18717565 Free PMC article.
-
Probing ribosome-nascent chain complexes produced in vivo by NMR spectroscopy.Proc Natl Acad Sci U S A. 2009 Dec 29;106(52):22239-44. doi: 10.1073/pnas.0903750106. Epub 2009 Dec 17. Proc Natl Acad Sci U S A. 2009. PMID: 20018739 Free PMC article.
-
Modulating co-translational protein folding by rational design and ribosome engineering.Nat Commun. 2022 Jul 22;13(1):4243. doi: 10.1038/s41467-022-31906-z. Nat Commun. 2022. PMID: 35869078 Free PMC article.
References
-
- Anfinsen CB. Science. 1973;181:223–230. - PubMed
-
- Dinner AR, Sali A, Smith LJ, Dobson CM, Karplus M. Trends Biochem Sci. 2000;25:331–339. - PubMed
-
- Brockwell DJ, Smith DA, Radford SE. Curr Opin Struct Biol. 2000;10:16–25. - PubMed
-
- Daggett V, Fersht A. Nat Rev Mol Cell Biol. 2003;4:497–502. - PubMed
-
- Vendruscolo M, Dobson CM. Philos Trans R Soc London Ser A. 2005;363:433–450. discussion 450–452. - PubMed
Publication types
MeSH terms
Substances
Grants and funding
LinkOut - more resources
Full Text Sources
Other Literature Sources
