. 2007 Oct 17;2(10):e1047.
doi: 10.1371/journal.pone.0001047.

Module-based outcome prediction using breast cancer compendia

Affiliations

Module-based outcome prediction using breast cancer compendia

Martin H van Vliet et al. PLoS One. .

Abstract

Background: The availability of large collections of microarray datasets (compendia), or knowledge about grouping of genes into pathways (gene sets), is typically not exploited when training predictors of disease outcome. These can be useful since a compendium increases the number of samples, while gene sets reduce the size of the feature space. This should be favorable from a machine learning perspective and result in more robust predictors.

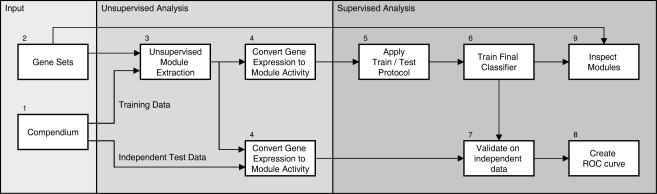
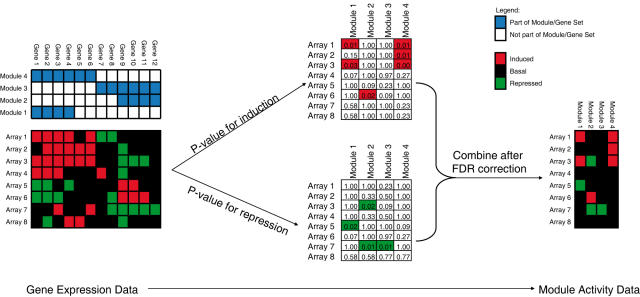
Methodology: We extracted modules of regulated genes from gene sets, and compendia. Through supervised analysis, we constructed predictors which employ modules predictive of breast cancer outcome. To validate these predictors we applied them to independent data, from the same institution (intra-dataset), and other institutions (inter-dataset).

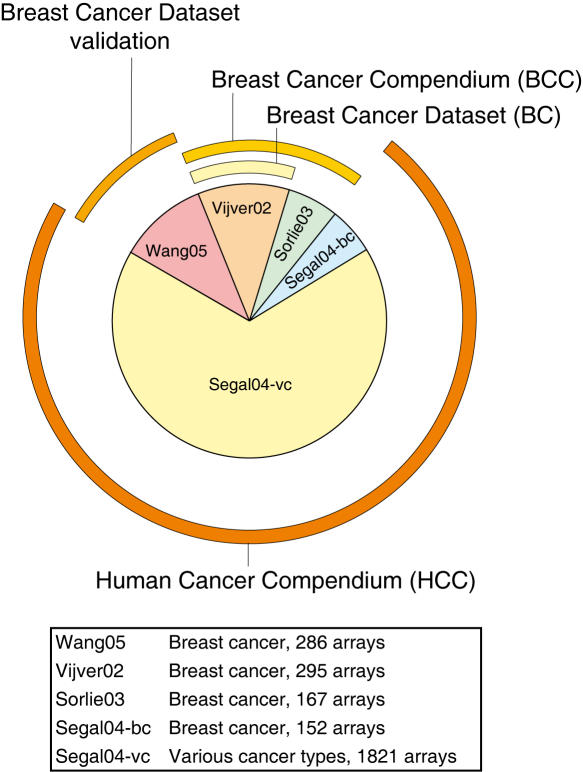
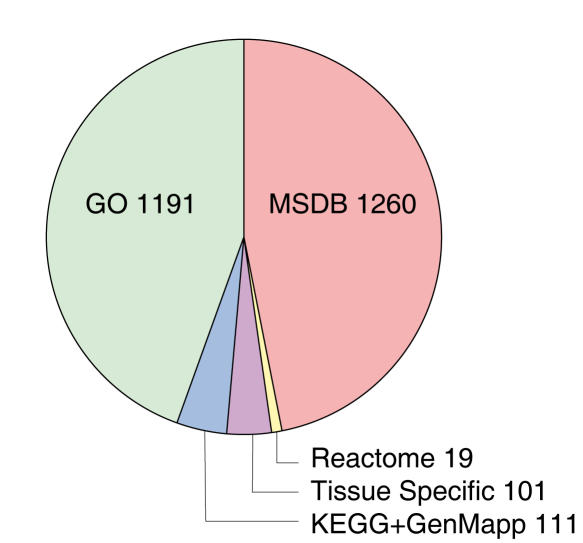
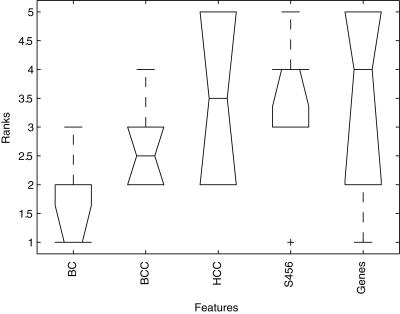
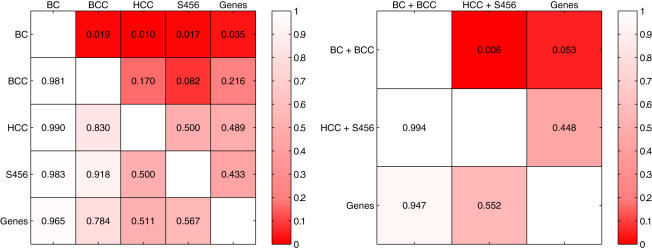
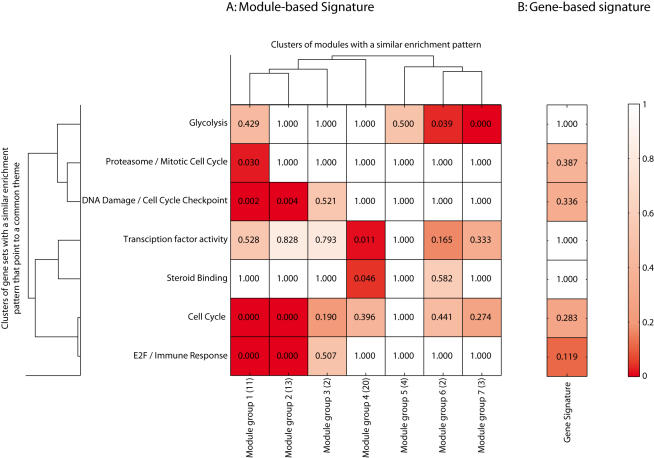
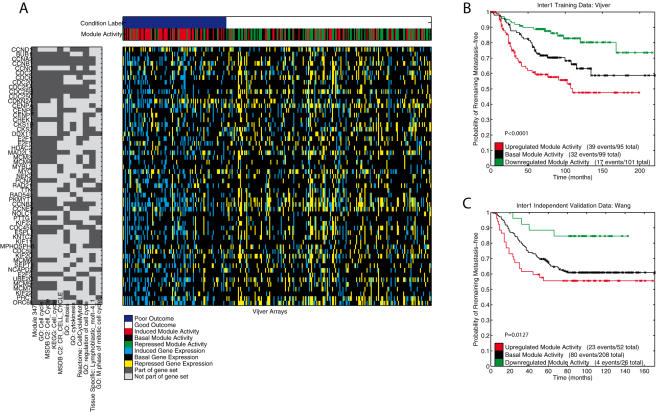
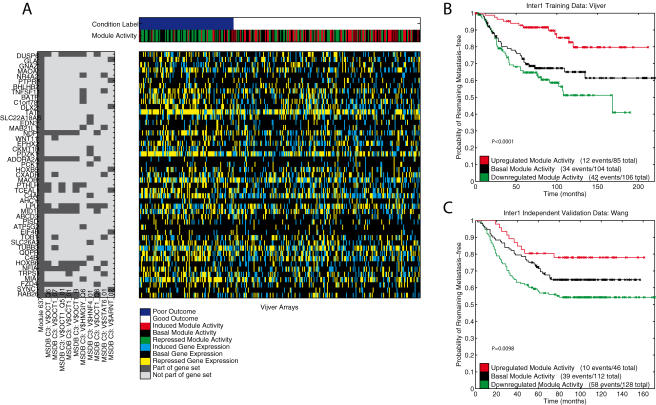
Conclusions: We show that modules derived from single breast cancer datasets achieve better performance on the validation data compared to gene-based predictors. We also show that there is a trend in compendium specificity and predictive performance: modules derived from a single breast cancer dataset, and a breast cancer specific compendium perform better compared to those derived from a human cancer compendium. Additionally, the module-based predictor provides a much richer insight into the underlying biology. Frequently selected gene sets are associated with processes such as cell cycle, E2F regulation, DNA damage response, proteasome and glycolysis. We analyzed two modules related to cell cycle, and the OCT1 transcription factor, respectively. On an individual basis, these modules provide a significant separation in survival subgroups on the training and independent validation data.


Conflict of interest statement

Competing Interests: The authors have declared that no competing interests exist.

Figures

Figure 1
Figure 1. Workflow of the approach.
We extended the analysis of compendia to the supervised classification domain. Several microarray datasets were collected to construct compendia at various levels of underlying phenotype diversity (1). Additionally, we gathered a collection of biologically meaningful gene sets from available databases (2). Using the module extraction framework proposed by , we derived sets of modules (3) from these compendia and gene sets. Using these modules we construct a module activity matrix (4), allowing modules rather than single genes to be used as features. The predictive power of the different sets of modules is inspected within a classification context. Using a train/test protocol (5), we estimated the generalization error of all sets of modules . Succeedingly, we trained a final classifier (6), which was then validated on independent data (7), and its performance assessed (8). Furthermore, the approach allows the final set of modules that were selected in the classifier to be compared to the original gene sets (9), allowing the identification of biological processes underlying the development and progression of cancer.
Figure 2
Figure 2. Compendia of microarray data.
Microarray datasets can be grouped into compendia at various levels of underlying phenotypic diversity. The pie-chart indicates datasets from various origins, sizes, and cancer types, and the compendia are indicated by the outer rings. The ’Inter1’ training-validation configuration is depicted in this figure ( as training, and as validation). This is one of the six configurations employed (See Table 1 for details).
Figure 3
Figure 3. Pie chart indicating the origin of the gene sets.
A total of 2682 gene sets were collected. The GO, KEGG, GenMapp, and Tissue specific gene sets were taken from the study by Segal et al. . The Reactome pathways were downloaded from the Reactome website , and the MSDB gene sets were taken from the molecular signature database .
Figure 4
Figure 4. Converting gene expression data into module activity data.
For a given gene expression dataset, and a set of modules we assessed the statistical significance of the overlap of induced/repressed genes with the modules using the hypergeometric distribution. This leads to two p-values for each array/module pair. These p-values are combined into a single discrete module activity score.
Figure 5
Figure 5. Boxplot showing ranked AUC results.
Boxplot showing the median ranks of the performance of each of the five feature types across the six experiments (see Table 1). In each of the six experiments the features were ranked based on the AUC obtained on the independent validation set (1 best, 5 worst).
Figure 6
Figure 6. Pairwise comparison of the five feature types.
Each cell (row = i, column = j) depicts the the p-value obtained by performing a one-sided Wilcoxon rank sum test with as alternative hypothesis that the median rank of type i is lower than type j, based on the AUCs achieved for each of the six experiments. The plot on the left shows individual comparisons, the plot on the right includes comparisons of groups of features. Cell-shading reflects the p-values.
Figure 7
Figure 7. Comparison of a module-based signature (A) and a gene-based signature (B).
The module-based signature from the Inter1 experiment contains 55 modules, and the gene-based signature contains 21 genes (Table 1). For both signatures an enrichment score for their overlap with the collection of 2682 gene sets was calculated based on the hypergeometric distribution. This resulted in a total of 319 gene sets that were enriched in at least one module or in the gene-based signature (p<0.05 after Bonferroni correction), see supplemental figure S4. Several modules turned out to have a similar pattern of enrichment across the gene sets. Additionally, gene sets that relate to a common theme turned out to have a similar enrichment pattern across the modules. Therefore, we clustered the matrix of p-values in both dimensions (2-dimensional, hierarchical clustering, complete linkage, Euclidean distance). The dendrograms at the top, and to the left indicate the clustering, where we chose to group either dimension into seven distinct groups. The labels on the left indicate the most common biological theme, and the label on the bottom indicates the groups of modules formed along with the number of modules in each group in brackets. The main table shows the median p-value for the enrichment of each of the seven clusters of modules, across these seven groups of gene sets. Similarly, the table on the right shows the median p-values for the gene signature. Shading of the cells reflects the p-values.
Figure 8
Figure 8. A cell cycle related module.
A) Module activity data of a Cell Cycle related module (Module group 2 in Figure 7) that was extracted from the Vijver data (Inter1, Table 1). The top heatmap shows the binary condition label, and the discrete module activity data (rows), for all the Vijver arrays (columns) . Arrays are ordered according to the metastasis free survival time. The heatmap in the middle shows the discrete gene expression data for the 55 genes (rows) in the module. On the left, a binary heatmap shows the 55 genes, along with the gene sets that show the most significant overlap with this module. The gene sets are ranked based on their p-value for the overlap with the module (hypergeometric distribution), we show the top 10 gene sets (p-values ranging from 10−51 to 10−25, all significant at p<0.05 after Bonferroni correction). On the right, two Kaplan-Meier curves indicate the predictive power of this module when arrays with the same module activity are grouped. B) The Kaplan-Meier curves for the three groups defined by the activity of this module on the Vijver data (Inter1 training, Table 1). C) The Kaplan-Meier curves for the three groups defined by the activity of this module on the independent data (Inter1 test data, Table 1). The legend indicates the three groups and lists the number of events and total number within the groups. P-values correspond to the logrank test.
Figure 9
Figure 9. An Oct1 related module.
A) Module activity data of an OCT1 transcription factor related module (Module group 4 in Figure 7) that was extracted from the Vijver data (Inter1, Table 1). The top heatmap shows the binary condition label, and the discrete module activity data (rows), for all the Vijver arrays (columns) . Arrays are ordered according to the metastasis free survival time. The heatmap in the middle shows the discrete gene expression data for the 47 genes (rows) in the module. On the left, a binary heatmap shows the 47 genes, along with the gene sets that show the most significant overlap with this module. The gene sets are ranked based on their p-value for the overlap with the module (hypergeometric distribution), we show the top 10 gene sets (p-values ranging from 10−13 to 10−7, all significant at p<0.05 after Bonferroni correction). On the right, two Kaplan-Meier curves indicate the predictive power of this module when arrays with the same module activity are grouped. B) The Kaplan-Meier curves for the three groups defined by the activity of this module on the Vijver data (Inter1 training, Table 1). C) The Kaplan-Meier curves for the three groups defined by the activity of this module on the independent data (Inter1 test data, Table 1). The legend indicates the three groups and lists the number of events and total number within the groups. P-values correspond to the logrank test.

Similar articles

Cited by

References

    1. Van 't Veer L, Dai H, van de Vijver M, He Y, Hart A, et al. Gene expression profiling predicts clinical outcome of breast cancer. Nature. 2002;415:530–6. - PubMed
    1. Sorlie T, Tibshirani R, Parker J, Hastie T, Marron J, et al. Repeated observation of breast tumor subtypes in independent gene expression data sets. PNAS. 2003;14:8418–23. - PMC - PubMed
    1. Wang Y, Klein J, Zhang Y, Sieuwerts A, Look M, et al. Gene-expression profiles to predict distant metastasis of lymph-node-negative primary breast cancer. The Lancet. 2005;365:671–9. - PubMed
    1. Van de Vijver M, He Y, van 't Veer L, Dai H, Hart A, et al. A gene-expression signature as a predictor of survival in breast cancer. N. Engl. J. Med. 2002;25:1999–2009. - PubMed
    1. Rhodes D, Yu J, Shanker K, Deshpande N, Varambally R, et al. Oncomine: a cancer microarray database and integrated data-mining platform. Neoplasia. 2004;1:1–6. - PMC - PubMed

Publication types

Substances