

Identification and classification of hubs in brain networks
- PMID: 17940613
- PMCID: PMC2013941
- DOI: 10.1371/journal.pone.0001049
Identification and classification of hubs in brain networks
Abstract
Brain regions in the mammalian cerebral cortex are linked by a complex network of fiber bundles. These inter-regional networks have previously been analyzed in terms of their node degree, structural motif, path length and clustering coefficient distributions. In this paper we focus on the identification and classification of hub regions, which are thought to play pivotal roles in the coordination of information flow. We identify hubs and characterize their network contributions by examining motif fingerprints and centrality indices for all regions within the cerebral cortices of both the cat and the macaque. Motif fingerprints capture the statistics of local connection patterns, while measures of centrality identify regions that lie on many of the shortest paths between parts of the network. Within both cat and macaque networks, we find that a combination of degree, motif participation, betweenness centrality and closeness centrality allows for reliable identification of hub regions, many of which have previously been functionally classified as polysensory or multimodal. We then classify hubs as either provincial (intra-cluster) hubs or connector (inter-cluster) hubs, and proceed to show that lesioning hubs of each type from the network produces opposite effects on the small-world index. Our study presents an approach to the identification and classification of putative hub regions in brain networks on the basis of multiple network attributes and charts potential links between the structural embedding of such regions and their functional roles.
Conflict of interest statement
Figures
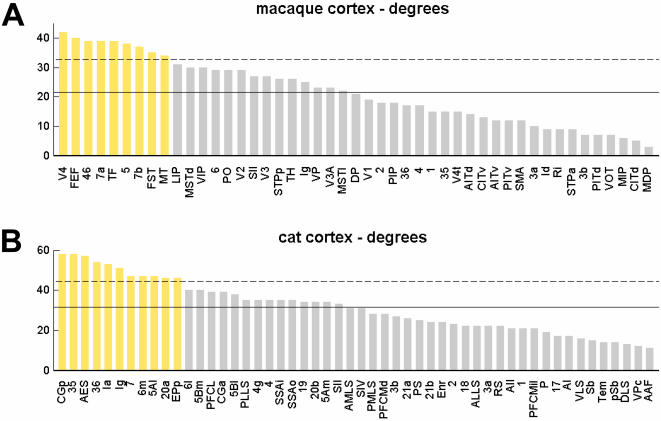
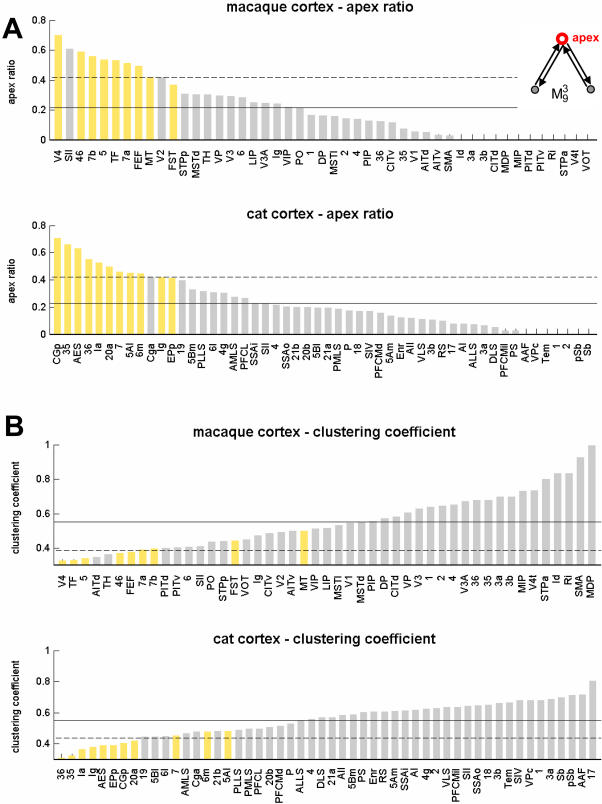
 that the region participates in (see inset). Areas are displayed in decreasing order. High-degree areas are displayed with yellow bars, others are displayed with gray bars. Horizontal lines mark the mean apex ratio (solid line) and the mean plus one standard deviation (dashed line). Panel B shows the ranked clustering coefficient for each area of macaque and cat cortex, with high-degree areas once again shown in yellow. Horizontal lines mark the mean clustering coefficient (solid line) and the mean minus one standard deviation (dashed line).
References
-
- Felleman DJ, Van Essen DC. Distributed hierarchical processing in the primate cerebral cortex. Cereb Cortex. 1991;1:1–47. - PubMed
-
- Scannell JW, Burns GAPC, Hilgetag CC, O'Neil MA, Young MP. The connectional organization of the cortico-thalamic system of the cat. Cereb Cortex. 1999;9:277–299. - PubMed
-
- Lewis JW, Van Essen DC. Mapping of architectonic subdivisions in the macaque monkey, with emphasis on parieto-occipital cortex. J Comp Neurol. 2000;428:79–111. - PubMed
-
- Sporns O, Chialvo D, Kaiser M, Hilgetag CC. Organization, development and function of complex brain networks. Trends Cogn Sci. 2004;8:418–425. - PubMed
-
- Sporns O. Graph theory methods for the analysis of neural connectivity patterns. In: Kötter R, editor. Neuroscience Databases. Boston: Klüwer; 2002. pp. 171–186.
Publication types
MeSH terms
LinkOut - more resources
Full Text Sources
Other Literature Sources
Miscellaneous
