. 2007 Sep;3(9):1727-38.
doi: 10.1371/journal.pcbi.0030173.

Structural reorganisation and potential toxicity of oligomeric species formed during the assembly of amyloid fibrils

Affiliations

Structural reorganisation and potential toxicity of oligomeric species formed during the assembly of amyloid fibrils

Mookyung Cheon et al. PLoS Comput Biol. 2007 Sep.

Abstract

Increasing evidence indicates that oligomeric protein assemblies may represent the molecular species responsible for cytotoxicity in a range of neurological disorders including Alzheimer and Parkinson diseases. We use all-atom computer simulations to reveal that the process of oligomerization can be divided into two steps. The first is characterised by a hydrophobic coalescence resulting in the formation of molten oligomers in which hydrophobic residues are sequestered away from the solvent. In the second step, the oligomers undergo a process of reorganisation driven by interchain hydrogen bonding interactions that induce the formation of beta sheet rich assemblies in which hydrophobic groups can become exposed. Our results show that the process of aggregation into either ordered or amorphous species is largely determined by a competition between the hydrophobicity of the amino acid sequence and the tendency of polypeptide chains to form arrays of hydrogen bonds. We discuss how the increase in solvent-exposed hydrophobic surface resulting from such a competition offers an explanation for recent observations concerning the cytotoxicity of oligomeric species formed prior to mature amyloid fibrils.


Conflict of interest statement

Competing interests. The authors have declared that no competing interests exist.

Figures

Figure 1
Figure 1. Representative Conformations in a Monte Carlo Simulation
Representative steps in a Monte Carlo simulation of Aβ16–22 showing the coalescence of individual peptide molecules into aggregates.
Figure 2
Figure 2. Time Dependence of the Population of Aβ16–22 Oligomers
The population P(Nc) was calculated as the sum over all the oligomers of a given size (Nc = 5 (red), 11 (green), and 14 (blue)) in a specific time window and in all the 100 independent simulations. We show P as a function of the β sheet content as defined by the local-order parameter βo. Each window corresponds to a different time point along the simulation. At early stages (left), configurations are highly disordered; at intermediate stages (centre), ordered structures start to appear; at late stages (right), the structures are rather well ordered.
Figure 3
Figure 3. Time Dependence of the Population of Aβ25–35 Oligomers
The population P(Nc) was calculated as the sum over all the oligomers of a given size (Nc = 5 (red), 8 (green), and 10 (blue)) in a specific time window and in all the 100 independent simulations. We show P as a function of the β sheet content as defined by the local-order parameter βo. Each window corresponds to a different time point along the simulation. At early stages (left), only small ordered oligomers are present, while at intermediate stages (centre), the size of ordered oligomers grows, and at late stages (right), the ordered oligomers are quite large.
Figure 4
Figure 4. Coalescence and Reorganisation of Aβ16–22
Competition between hydrophobicity and hydrogen bonding in the formation of ordered oligomers formed by the Aβ16–22 peptide. (A) Average interchain hydrogen-bond energy per chain and (B) average interchain hydrophobic energy with respect to the order parameter β. Two representative oligomer configurations are shown corresponding to β = 0 and β = 0.36; comparison of these structures illustrates the process of internal reorganisation that leads to increases in both the number of hydrogen bonds and in the exposure of hydrophobic groups (gray spheres).
Figure 5
Figure 5. One-Step Ordering of Aβ25–35 Oligomers
Competition between hydrophobicity and hydrogen bonding in the ordering process of the oligomers formed by the Aβ25–35 peptide. As in Figure 4, we report the average interchain hydrogen-bond energy per chain (A), and the average interchain hydrophobic energy with respect to the order parameter β (B). Two representative oligomer configurations are shown corresponding to β = 0 and β = 0.58. As opposed to the case of the Aβ16–22 peptide shown in Figure 4, however, there is no evidence of structural reorganization within the oligomers, and therefore even small oligomers are ordered, provided that the overall degree of order in the ensemble, β, is very small due to the large fraction of unstructured monomers present in the system.
Figure 6
Figure 6. Populations of Oligomers and β Sheets
Populations of oligomers (blue) and β sheets (red) as a function of the oligomer and β sheet size for different concentrations and temperatures Aβ16–22, box size B = 130 and temperature T = 295 K (A). (B) Aβ16–22, box size B = 130 and temperature T = 335 K. (C) Aβ16–22, box size B = 130 and temperature T = 370 K. (D) Aβ16–22, box size B = 60 and temperature T = 295 K. (E) Aβ25–35, box size B = 60 and temperature T = 295 K. (F) Aβ16–22, box size B = 60 and temperature T = 330 K.
Figure 7
Figure 7. Populations of Oligomers as a Function of the Total Number of β Sheets Contained within the Oligomers
The hydrophobic interactions that drive the coalescence and hence the formation of Aβ16–22 oligomers (left), results in aggregates with complex structures containing many small β sheets. On the other hand, the hydrogen bond interactions that drive the oligomerization of the Aβ25–35 fragments (right) result in simpler structures with a small number of β sheets.
Figure 8
Figure 8. Surface-to-Volume Dependence for the Exposure of Hydrophobic Residues in Oligomeric Species
Average hydrophobic energy per peptide for oligomers containing six peptide molecules (i.e., Nc = 6, green line) and 11 peptide molecules (i.e., Nc = 11 blue line) as a function of the β sheet content within the oligomer. As examples, two selected oligomeric configurations, both with the same degree of order, βo = 0.38, are shown on the right. Large oligomers have a lower surface-to-volume ratio, and this results in a smaller number of exposed hydrophobic residues per peptide molecule.
Figure 9
Figure 9. Time Dependence of the Total Exposed Hydrophobic Area in the Oligomeric Ensemble
Time dependence of the solvent-exposed hydrophobic surface area (S) for the Aβ16–22 fragment (see Methods). Two competing processes contribute to the evolution of the species. At early times, S increases due to the reorganisation process of the initially formed oligomers driven by the formation of hydrogen bonds. By contrast, S decreases as the typical size of the oligomers grows and the surface-to-volume ratio becomes smaller and the consequent decrease in the number of oligomers present in the system. In the inset we show an expansion of the early time points representing the effect of the initial hydrophobic coalescence of the monomers into disordered oligomers.
Figure 10
Figure 10. Schematic Diagram of the Two-Step Mechanism of Amyloid Formation
Schematic diagram of the mechanistic pathway resulting in the formation of ordered oligomers, described in this study, showing an effective one-step process involving the assembly of monomers directly into β sheet rich oligomers (top) and a more general two-step process, where the monomers coalesce to form molten oligomers before undergoing a process of conformational conversion (bottom). The boxes show representative structures from simulations of Aβ16–22 (lower and left panels) and Aβ25–35 (top and right panels).
Figure 11
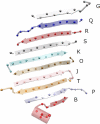
Figure 11. Example of Calculation of the Residue-Specific Local Order
An example of an ordered oligomer with Nc = 10 for 20 Aβ25–35 peptides after 109 Monte Carlo steps. The spheres on each peptide chain stand for Cα atoms. The βi,j values of each peptide chain are given as G(01111110000), Q(00111111110), R(01111111111), S(01111111110), K(00111111111), O(00111111111), J(01111111000), T(01111110000), P(01111111000), and B(00000000100). The two different ways of averaging the β sheet parameter (β and βo) are calculated as β = 111/220 where 111 is the total number of ordered residues in the ensemble of 20 peptides and 220 is the total number of residues (20 × 11), and βo = 72/110 where 72 is the number of ordered residues in the oligomer shown above and 110 the total number of residues within this particular oligomer (10 × 11).

References

    1. Selkoe DJ. Folding proteins in fatal ways. Nature. 2003;426:900–904. doi: 10.1038/nature02264. Available: http://dx.doi.org/10.1038/nature02264. Accessed 8 August 2007. - DOI - DOI - PubMed
    1. Roberson ED, Mucke L. 100 years and counting: Prospects for defeating Alzheimer disease. Science. 2006;314:781–784. doi: 10.1126/science.1132813. http://dx.doi.org/10.1126/science.1132813. Accessed 8 August 2007. - DOI - DOI - PMC - PubMed
    1. Lansbury PT, Lashuel HA. A century-old debate on protein aggregation and neurodegeneration enters the clinic. Nature. 2006;443:774–779. doi: 10.1038/nature05290. Available: http://dx.doi.org/10.1038/nature05290. Accessed 8 August 2007. - DOI - DOI - PubMed
    1. Dobson CM. Protein misfolding, evolution and disease. Trends Biochem Sci. 1999;24:329–332. - PubMed
    1. Dobson CM. Protein folding and misfolding. Nature. 2003;426:884–890. doi: 10.1038/nature02261. Available: http://dx.doi.org/10.1038/nature02261. Accessed 8 August 2007. - DOI - DOI - PubMed

Publication types