. 2007 Oct 16;5(10):e276.
doi: 10.1371/journal.pbio.0050276.

Assessing tumor progression factors by somatic gene transfer into a mouse model: Bcl-xL promotes islet tumor cell invasion

Affiliations

Assessing tumor progression factors by somatic gene transfer into a mouse model: Bcl-xL promotes islet tumor cell invasion

Yi-Chieh Nancy Du et al. PLoS Biol. .

Abstract

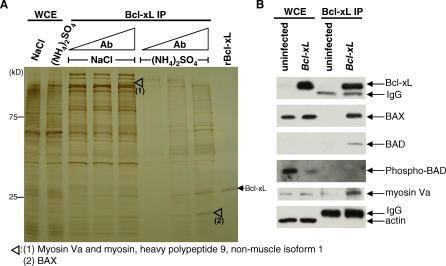
Tumors develop through multiple stages, implicating multiple effectors, but the tools to assess how candidate genes contribute to stepwise tumor progression have been limited. We have developed a novel system in which progression of phenotypes in a mouse model of pancreatic islet cell tumorigenesis can be used to measure the effects of genes introduced by cell-type-specific infection with retroviral vectors. In this system, bitransgenic mice, in which the rat insulin promoter (RIP) drives expression of both the SV40 T antigen (RIP-Tag) and the receptor for subgroup A avian leukosis virus (RIP-tva), are infected with avian viral vectors carrying cDNAs encoding candidate progression factors. Like RIP-Tag mice, RIP-Tag; RIP-tva bitransgenic mice develop isolated carcinomas by approximately 14 wk of age, after progression through well-defined stages that are similar to aspects of human tumor progression, including hyperplasia, angiogenesis, adenoma, and invasive carcinoma. When avian retroviral vectors carrying a green fluorescent protein marker were introduced into RIP-Tag; RIP-tva mice by intra-cardiac injection at the hyperplastic or early dysplastic stage of tumorigenesis, approximately 20% of the TVA-positive cells were infected and expressed green fluorescent proteins as measured by flow cytometry. Similar infection with vectors carrying cDNA encoding either of two progression factors, a dominant-negative version of cadherin 1 (dnE-cad) or Bcl-xL, accelerated the formation of islet tumors with invasive properties and pancreatic lymph node metastasis. To begin studying the mechanism by which Bcl-xL, an anti-apoptotic protein, promotes invasion and metastasis, RIP-Tag; RIP-tva pancreatic islet tumor cells were infected in vitro with RCASBP-Bcl-xL. Although no changes were observed in rates of proliferation or apoptosis, Bcl-xL altered cell morphology, remodeled the actin cytoskeleton, and down-regulated cadherin 1; it also induced cell migration and invasion, as evaluated using two-chamber transwell assays. In addition, myosin Va was identified as a novel Bcl-xL-interacting protein that might mediate the effects of Bcl-xL on tumor cell migration and invasion.


Conflict of interest statement

Competing interests. The authors have declared that no competing interests exist.

Figures

Figure 1
Figure 1. Characterization of RIP-tva Transgenic Mice
(A) The RIP-tva transgene. The 800-bp tva cDNA was cloned into a XbaI/HindIII-digested plasmid that contains the 5′ flanking region of the rat insulin II gene and transcription termination sequences (An) (details in Materials and Methods). (B and C) Confocal microscopic images show immunofluorescent membrane staining of TVA (red) and nuclear staining of PDX1 (green) in pancreatic sections of 2-d-old RIP-tva transgenic (B) and non-transgenic (C) animals. Nuclei were stained with DAPI (blue). Original magnification, 630×. The images are representative of 20 fields from 12 mice analyzed. (D) Confocal microscopic immunofluorescent image of hyperplastic islet cells revealed TVA (red) and PDX1 (green) in pancreatic section of a 7-wk-old RIP-Tag; RIP-tva bitransgenic animal. The image is representative of 15 fields from three mice analyzed. (E) The adjacent section of (D) was immunostained for SV40 T antigen. The image is representative of 15 fields from three mice analyzed. Ex, exocrine tissue.
Figure 2
Figure 2. Infection of RIP-Tag; RIP-tva Pancreatic Islet Cells In Vitro and In Vivo
(A) Experimental strategy. RIP-Tag transgenic mice were crossed with RIP-tva transgenic mice to generate RIP-Tag; RIP-tva bitransgenic mice. For in vitro experiments, tumors from 16-wk-old bitransgenic mice were isolated and cultured in vitro, and tumor cells were infected with RCASBP viruses (left). For in vivo infection, RCASBP viruses were delivered into 7-wk-old bitransgenic animals through intra-cardiac (I.C.) injection. Characterization of islet cells/tumors was performed 2, 5, or 9 wk after viral delivery (right). (B and C) Example of infection in vitro with an RCASBP vector. Bright-field image of RIP-Tag; RIP-tva tumor cells infected with RCASBP-GFP in vitro (B) and fluorescent image showing GFP expression (C) were taken 1 wk after infection. The images are representative of more than 20 fields from two independent infections. (D) Flow cytometry plots of islet cells from wide-type mouse (C57BL/6) injected with RCASBP-GFP (upper left), RIP-tva transgenic mouse injected with RCASBP-GFP (upper right), and RIP-Tag; RIP-tva bitransgenic mice injected with RCASBP-ALPP (lower left) or RCASBP-GFP (lower right) via intra-cardiac injection. RCASBP viral supernatants were delivered at the age of 7 wk. Two weeks later, mice were sacrificed, and pancreases were digested into single-cell suspension. Cells were analyzed for TVA+ and GFP by FACS. The percentage of cells in each gated panel is indicated in the corners. Approximately 11%–18% of pancreatic cells isolated from RIP-tva or RIP-Tag; RIP-tva bitransgenic mice by this method were TVA+ (upper quadrants), and about 20% of TVA+ cells from bitransgenic animals infected with RCASBP-GFP expressed GFP.
Figure 3
Figure 3. RIP-Tag; RIP-tva Islet Tumorigenesis and Examples of Histological Categories
(A) Schematic representation of the RIP-Tag; RIP-tva islet tumorigenesis (modified from the RIP1-Tag2 Manual, Hanahan laboratory, unpublished). RCASBP retroviruses carrying genes of interest were introduced into the hyperplastic islets of 7-wk-old mice through intra-cardiac injection. Mice were sacrificed at 16 wk of age for histological staging and grading to determine tumor incidence and phenotype as shown in Table 1. (B–D) Hematoxylin and eosin stain of representative examples of IT (B), IC-1 (C), and IC-2 (D).
Figure 4
Figure 4. Detection of Metastasis and Assessment of the Differentiation Status of IC-2 from Mice Infected with RCASBP-Bcl-xL and RCASBP-dnE-cad
(A) Representative images of lymph node metastases found in six mice infected with RCASBP-dnE-cad (upper panel) or in seven mice infected with RCASBP-Bcl-xL (lower panel). Immunohistochemical staining of insulin II in metastatic β-cell tumor cells in pancreatic lymph nodes is shown. Original magnification, 200×. (B) About 4.5% of IC-2 found in mice infected with RCASBP-dnE-cad or RCASBP-Bcl-xL do not express insulin II. Immunohistochemical staining of synaptophysin, a neuroendocrine marker (left), and insulin II (right) in β-cell tumor cells in pancreatic sections from mice injected with RCASBP-dnE-cad (upper panel) or RCASBP-Bcl-xL (lower panel). Original magnification, 200× (upper panel) and 100× (lower panel).
Figure 5
Figure 5. RCASBP-Bcl-xL Enhances Tumorigenesis in RIP-Tag; RIP-tva Mice
RIP-Tag; RIP-tva mice were injected with RCASBP-ALPP (control), RCASBP-Bcl-xL, or RCASBP-dnE-cad at 7 wk of age, and were sacrificed at the indicated ages for histopathological analysis. (A) Proliferative index (upper panel) and apoptotic index (lower panel) in the tumors from 16-wk-old mice injected with RCASBP-ALPP (control), RCASBP-Bcl-xL, or RCASBP-dnE-cad were determined. Pancreatic sections were stained with antibodies against Ki67 or activated caspase 3. Data shown are the mean percentage ± standard deviation from ten tumors of each group. (B and C) Mice injected with RCASBP-ALPP (control) or RCASBP-Bcl-xL were sacrificed at the indicated ages to evaluate tumor burden (B, upper panel). A standard formula for tumor volume was applied (volume [mm3] = 0.52 × width2 × length). Tumor burden per mouse is the sum of the tumor volume. Pancreatic sections were stained with synaptophysin for identification of islet cells. Tumor incidence was determined (B, lower panel), and the different categories of tumors were counted (C).
Figure 6
Figure 6. PCR Analysis to Verify the Presence of the RCASBP Proviral DNA in the Tumors
(A and B) Tumor DNAs were extracted from freshly microdissected tumors or paraffin-embedded pancreatic sections from mice 9 wk after mice were infected with RCASBP-Bcl-xL or RCASBP-ALPP. PCR was performed using RCASBP-specific primers or ACTB (β-actin)–specific primers. The presence of RCASBP proviruses in the genomic DNA was detected in ten of 25 tumors from mice infected with RCASBP-Bcl-xL (A) and two of the 20 tumors from mice infected with RCASBP-ALPP (B). (C) The presence of RCASBP proviruses in the genomic DNA was detected in nine of nine pancreatic lymph node metastases from mice infected with RCASBP-Bcl-xL (n = 4) or RCASBP-dnE-cad (n = 5). +, RCASBP plasmid DNA used as template DNA in PCR; Normal, normal lymph node.
Figure 7
Figure 7. Redistribution of the Actin Cytoskeleton in RCASBP-Bcl-xL-Infected Tumor Cells
(A) Frozen pancreatic sections from a wild-type mouse (left panel), a mouse 2 wk after RCASBP-Bcl-xL infection (middle panel), and a mouse 5 wk after RCASBP-ALPP infection (right panel) were stained with rhodamine-phalloidin for F-actin (red) and DAPI (blue). The presence of RCASBP-Bcl-xL proviral DNA in the tumor (middle panel) was confirmed by PCR. Three mice each at 2 and 5 wk after RCASBP-Bcl-xL delivery and at 5 wk after RCASBP-ALPP delivery were analyzed. Ex, exocrine tissue; I, islet; Tu, tumor tissue. (B and C) RIP-Tag; RIP-tva tumor cells change morphology in vitro after being infected with RCASBP-Bcl-xL. (B) Bright-field images of uninfected tumor cells and cells infected with RCASBP-GFP, RCASBP-Bcl-xL, or RCASBP-dnE-cad. Tumor cells infected with RCASBP-Bcl-xL have a less organized epithelial sheet structure. Original magnification, 200×. (C) Tumor cells were cultured on chamber slides and immunostained with rhodamine-phalloidin for F-actin. Tumor cells infected with RCASBP-Bcl-xL have decreased cortical actin. Scale bars, 20 μm. The images are representative of more than ten fields in each experiment.
Figure 8
Figure 8. Bcl-xL Has Profound Effects on Cell Migration and Invasion, and Reduces Cadherin 1 In Vitro
(A and B) Cell migration and invasion. Uninfected tumor cells or tumor cells infected with RCASBP-GFP, RCASBP-Bcl-xL, or RCASBP-dnE-cad were plated in the upper chambers of transwell plates (A) or of Matrigel invasion plates (B). Data are presented as the mean numbers of cells counted in the lower chambers in five fields under 20× magnification after 72 h, and are representative of three independent experiments. (C and D) Proliferative and apoptotic indices of the four different cell lines. Cultures grown on chamber slides from uninfected tumor cells or cells infected with RCASBP-GFP, RCASBP-Bcl-xL, or RCASBP-dnE-cad were stained with antisera against Ki67 (C) or activated caspase 3 (D). Data shown are the mean percentage ± standard deviation from triplicate experiments. (E) Reduced protein levels of cadherin 1 and elevated snail homolog 1 levels in the tumor cell lines infected with RCASBP-Bcl-xL. Whole cell extracts (WCE; 20 μg) from uninfected tumor cells or tumor cells infected with RCASBP-Bcl-xL were analyzed by Western blotting using antisera against the cytosolic domain of cadherin 1 (clone 36), snail homolog 1, and Bcl-xL. Actin was measured as a loading control. (F) Two anti–cadherin 1 antibodies (clones ECCD-2 and 36) were used to perform IP from whole cell extracts of uninfected tumor cells and tumor cells infected with RCASBP-dnE-cad or RCASBP-Bcl-xL. The precipitates were subjected to Western blotting using an antibody against the cytosolic domain of cadherin 1 (clone 36). Two lanes without WCE were used to identify the bands attributable to IgGs (lanes 7 and 11). A portion of nitrocellulose membrane stained with Ponceau S is shown as a loading control.
Figure 9
Figure 9. Bcl-xL Interacts with BAX, Unphosphorylated BAD, and Myosin Va in the Tumor Cells Infected with RCASBP-Bcl-xL
(A) Whole cell extracts of tumor cells infected with RCASBP-Bcl-xL were prepared in cell lysis buffer containing 150 mM NaCl or 100 mM (NH4)2SO4 (L100 buffer), and subjected to IP with increasing amounts of an anti-Bcl-xL antibody. The precipitates and 5 ng of recombinant human Bcl-xL (rBcl-xL) were analyzed by SDS-PAGE and silver staining. The putative Bcl-xL-interacting bands (open arrowheads) were excised from the gel for mass spectrometry. The identities of the proteins are listed. Both myosin Va and myosin, heavy polypeptide 9, non-muscle isoform 1 were identified by mass spectrometry using proteins from the excised area labeled “(1).” (B) Whole cell extracts of uninfected tumor cells and tumor cells infected with RCASBP-Bcl-xL were prepared in L100 buffer, and subjected to IP with an anti-Bcl-xL antibody. The precipitates were analyzed by SDS-PAGE and Western blotting using specific antibodies against Bcl-xL, BAX, BAD, phospho-BAD, myosin Va, and actin. Four of these proteins, Bcl-xL, BAX, BAD, and myosin Va, were found in anti-Bcl-xL IP from cells infected with RCASBP-Bcl-xL.

Similar articles

Cited by

References

    1. Vogelstein B, Kinzler KW. The multistep nature of cancer. Trends Genet. 1993;9:138–141. - PubMed
    1. Golub TR, Slonim DK, Tamayo P, Huard C, Gaasenbeek M, et al. Molecular classification of cancer: Class discovery and class prediction by gene expression monitoring. Science. 1999;286:531–537. - PubMed
    1. Sjoblom T, Jones S, Wood LD, Parsons DW, Lin J, et al. The consensus coding sequences of human breast and colorectal cancers. Science. 2006;314:268–274. - PubMed
    1. Hanahan D, Weinberg RA. The hallmarks of cancer. Cell. 2000;100:57–70. - PubMed
    1. Jonkers J, Berns A. Conditional mouse models of sporadic cancer. Nat Rev Cancer. 2002;2:251–265. - PubMed

Publication types

MeSH terms