. 2007 Oct 16;5(10):e277.
doi: 10.1371/journal.pbio.0050277.

Characterization of sleep in zebrafish and insomnia in hypocretin receptor mutants

Affiliations

Characterization of sleep in zebrafish and insomnia in hypocretin receptor mutants

Tohei Yokogawa et al. PLoS Biol. .

Abstract

Sleep is a fundamental biological process conserved across the animal kingdom. The study of how sleep regulatory networks are conserved is needed to better understand sleep across evolution. We present a detailed description of a sleep state in adult zebrafish characterized by reversible periods of immobility, increased arousal threshold, and place preference. Rest deprivation using gentle electrical stimulation is followed by a sleep rebound, indicating homeostatic regulation. In contrast to mammals and similarly to birds, light suppresses sleep in zebrafish, with no evidence for a sleep rebound. We also identify a null mutation in the sole receptor for the wake-promoting neuropeptide hypocretin (orexin) in zebrafish. Fish lacking this receptor demonstrate short and fragmented sleep in the dark, in striking contrast to the excessive sleepiness and cataplexy of narcolepsy in mammals. Consistent with this observation, we find that the hypocretin receptor does not colocalize with known major wake-promoting monoaminergic and cholinergic cell groups in the zebrafish. Instead, it colocalizes with large populations of GABAergic neurons, including a subpopulation of Adra2a-positive GABAergic cells in the anterior hypothalamic area, neurons that could assume a sleep modulatory role. Our study validates the use of zebrafish for the study of sleep and indicates molecular diversity in sleep regulatory networks across vertebrates.


Conflict of interest statement

Competing interests. The authors have declared that no competing interests exist.

Figures

Figure 1
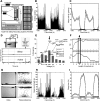
Figure 1. Characterization of Rest in Zebrafish as a Sleep-Like State
(A) AFSRS. Images are recorded through backlit chambers using an infrared video camera (30 frames/s), and software then detects and tracks the fish and its movements (see Materials and Methods). See also Video S5. (B) Activity of a single fish displayed as pixels/s for each minute over 2 d with 14 h: 10 h light/dark conditions. Note alternation of periods of activity and inactivity. (C) Mean activity of 13 normal adult fish across the light/dark cycle (± standard error of the mean, represented as shaded areas). Data are plotted as the mean of 2-h blocks, after a 3-d habituation period. (D) Arousal threshold and electrical stimulation experiments. The upper panel shows the electrical stimulation apparatus that applies stimuli through stainless steel sidewalls. Stimuli of various voltages (0–2 V) are applied for 10 ms every 30 min over the 24-h period. Video clips including 30 s of data prior to and after the stimulation are automatically generated (see Video S2). Object velocity (lower panels) and shape change (data not shown) are used to score response, together with visual inspection of the video clips. In the example shown, a stimulus of 1 V for 10 ms is applied at time “0” in two fish. Behavior is scored as “sleep” or “active” based on the existence of movements prior to the stimulation and the video clip. Responses are classified as absent (top) or present (bottom). Note response in fish with higher baseline activity (bottom). (E) Electrical stimulus dose response experiments in fish in active or sleep states. Pulses randomly ranging from 0 to 2 V were applied every 30 min through the day and night. Response and sleep/active status were scored, with no habituation noted. The results presented here used a definition of 6 s of prior inactivity as “sleep.” The curve depicts the percentage of stimuli eliciting responses (movement) at increasing voltage strengths in fish demonstrating prior sleep or active states. Numbers indicate the number of stimulus instances and number of animals (in parentheses). Note that as voltage increased, progressively more animals demonstrated a response, but animals scored as active reacted to lower voltages (p < 0.01 at voltage ranging from 0.25 to 0.5 V using Chi2). At high voltage, all animals demonstrated a response regardless of prior activity state (i.e., ∼100% at 2 V). Stimuli of 0.38 V (arrow) produced the largest differential response between fish in active and sleep states (bar graph). (F) Quantitative ROC analyses were performed to examine the optimum interval of prior inactivity (<6 pixels/s) that was associated with increased arousal threshold [56]. SE and SP for response to stimulation were computed for animals in active and inactive states. Note that 6 s of prior inactivity was the best discriminating value in terms of SE and SP, and was thus adopted to form our definition of sleep in adult zebrafish (boxed area indicated by arrow). (G) Place preference and characteristic posture during sleep. Left panels show characteristic posture (drooping caudal fin) during sleep (for typical example, see also Video S1). Right panel shows location of sleep occurrences (<6 pixels/s for at least 6 s) plotted as dots over the 24-h period. Sleep occurred either near the surface of the water or at the bottom of the recording chamber, with some interindividual preferences. (H) Sleep bout length (in seconds) in a single fish, integrated every 10 min over 2 d. For every 10 min, the mean length of inactivity periods lasting at least 6 s is calculated. Note presence of some sleep bouts even during the day. (I) Mean percent sleep time of 13 normal adult fish (± standard error of the mean, represented as shaded areas) across the light/dark cycle, after a 3-d habituation period. Data are plotted as the mean of 2-h blocks. Note the extremely strong nocturnal preference for sleep in adult zebrafish (5.1% ± 1.3% of time during the day, 58.1% ± 3.3% of time during the night).
Figure 2
Figure 2. Homeostatic Regulation of Zebrafish Sleep
(A) Illustration of the sleep deprivation protocol. An electrical pulse (2 V, 10 ms) is applied when the target fish displays sleep. When the fish does not respond within 3 s, the stimulus is increased stepwise (2 V per step) to a maximum of 6 V. If the fish does not react to the 6-V stimulus, stimulation is repeated. A yoked control fish is stimulated at the same time in a different chamber (independent of its sleep/wake state), to control for the stress of the procedure. For video recordings of sleep-deprived fish at the beginning of the stimulation period and at the end of the 6-h procedure, see Videos S3 and S4, respectively. (B) Quantitative effects of sleep deprivation using electrical stimulation or light, as applied 6 h prior to usual light onset, with release in the dark or the light. The procedure induces a ∼30% loss of sleep over the 6-h period, while yoked stimulated controls have ∼10% less sleep. Groups are compared using ANOVA with grouping factors (all models significant, except recovery in light), followed by post hoc testing and Bonferroni corrections. A greater amount of recovery sleep is observed in sleep-deprived animals than in undisturbed controls and yoked stimulated animals (#, p < 0.05 sleep-deprived versus controls; *, p < 0.05 sleep-deprived versus yoke controls; **, p < 0.01). A partial rebound is also observed in yoked stimulated controls. Sleep bout length also increased during the rebound period. Interestingly, light almost completely suppressed sleep (∼90%) without any apparent recovery (even when monitoring was conducted for a subsequent 48 h; data not shown). Similarly, sleep deprivation by electrical stimulation is not associated with a sleep rebound when animals are released in the light (right panel).
Figure 3
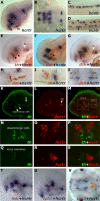
Figure 3. hcrtr Is Not Expressed in Monoaminergic Nuclei at 2 dpf
Results were all obtained using ISH. (A–D) hcrtr is expressed in the brain and spinal cord. (A) Lateral view of hcrtr expression in telencephalon (t), hypothalamus (ht), hypophysis (hp), posterior tuberculum (pt), and ventral rhombomere 2 (r2). (B) Dorsal view of hcrtr expression in the same structures. (C) Lateral view of spinal cord hcrtr expression. (D) Dorsal view of spinal cord (sc) hcrtr expression. Note the expression at the periphery of the spinal cord. Limits between somatic muscles and spinal cord tissue are indicated by black arrowheads. (E–J) Two-color ISH, flat mounts. (E) Lateral view of a hemi-brain stained for hcrtr (blue) and tyrosine hydroxylase (th, red); locus coeruleus (lc) is indicated by a white arrowhead; dopaminergic clusters by black arrowheads. (F) Lateral view of a hemi-brain stained for hcrtr (blue) and dopamine transporter (dat, red). (G) Lateral view of hemi-brain stained for hcrtr (blue) and dopamine beta hydroxylase (dbh, red). (H) Lateral close-up showing the absence of hcrtr expression in dopaminergic cells. (I) Lateral close-up showing absence of hcrtr expression in the locus coeruleus. (J) Dorsal close-up confirming absence of colocalization in the locus coeruleus. (K–S) Double fluorescent ISH, confocal microscopy pictures (stacks of 0.5- or 1-μm sections). (K and L) Lateral view of a hemi-brain stained for tyrosine hydroxylase (K) (th, green) and hcrtr (L) (red). (M) Merged view; note absence of yellow, indicating no colocalization. (N–P) From boxed area in (M), close-up of the diencephalic dopaminergic region and absence of hcrtr colocalization (P). (Q–S) From boxed area in (M), close-up on the locus coeruleus region and absence of hcrtr colocalization (S). (T) Lateral view of a flat-mounted hemi-brain stained for hcrtr (blue) and histidine decarboxylase (hdc, red). Note absence of colocalization. (U and V) Flat mounts. Lateral (hemi-brain) and ventral views of embryos stained for hcrtr (blue) and tryptophan hydroxylase 1 (tph1) (U) and tph2 (V), respectively. Note absence of colocalization.
Figure 4
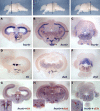
Figure 4. hcrtr Is Expressed in Neither the Posterior Diencephalic Dopaminergic Cells nor the Locus Coeruleus of Adult Zebrafish Brain
The topmost panels display lateral views of zebrafish adult brains with transversal plane corresponding to sections presented below. Results were all obtained using ISH. (A–C) hcrtr mRNA is expressed in the periventricular gray zone of optic tectum (pgz), periventricular nucleus of the posterior tuberculum (tpp), posterior tuberal nucleus (ptn), and ventral zone of periventricular hypothalamus (hv) of the anterior diencephalon (A). In the posterior diencephalon (B), hcrtr mRNA is mainly detected in the periventricular gray zone of optic tectum, medial preglomerular nucleus (pgm), and hypophysis (hp). hcrtr has a sparse expression in the anterior rhombencephalon (C), including the griseum centrale (gc) near the locus coeruleus. (D–F) th, dat, and dbh expression patterns in sections similar to those shown in (A–C), respectively. th is expressed in posterior tuberal nucleus and ventral zone of periventricular hypothalamus and in the torus longitudinalis (tl) (D). dat expression is restricted to a few posterior tuberal nucleus cells in the posterior diencephalon (E). dbh is expressed in the locus coeruleus (lc) (F). (G–I) Double ISH on equivalent sections showing colocalization of hcrtr (blue) with th (red) in the anterior catecholaminergic/dopaminergic cells of the diencephalon (G), absence of colocalization of hcrtr (blue) with dat (red) in the posterior catecholaminergic/dopaminergic cells of the diencephalon (H), and absence of colocalization of hcrtr (blue) with dbh (red) in the catecholaminergic/noradrenergic locus coeruleus (I).
Figure 5
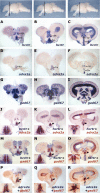
Figure 5. hcrtr Coexpression with GABAergic, Adrenergic, Cholinergic, and Glycinergic Systems in 2-dpf Larvae
Results were all obtained using ISH. (A) Lateral view of a flat-mounted hemi-brain stained for hcrtr (blue) and gad67 (red). Note multiple areas of overlap indicated by black arrowheads. (B) Lateral view of a flat-mounted hemi-brain stained for hcrtr (blue) and adra2a (red). Double staining in the anterior hypothalamus and telencephalon is indicated by arrowheads. (C) Lateral view of a flat-mounted hemi-brain stained for hcrtr (blue) and chat (red). Double-stained regions are indicated by black arrowheads. (D) Lateral views of spinal cord stained for hcrtr (blue) and glyt2 (red). Note that most hcrtr neurons but not all (white arrowhead) are glycinergic. (E) Lateral views of spinal cord stained for hcrtr (blue) and gad67 (red). Note that all hcrtr neurons are GABAergic.
Figure 6
Figure 6. A Population of Anterior Hypothalamic hcrtr-Positive Neurons is adra2a- and gad67-Positive
The topmost panels display lateral views of zebrafish adult brain with transversal plane corresponding to sections presented below. Results were all obtained using ISH. (A–I) Single ISH expression patterns of hcrtr (A–C), adra2a (D–F), and gad67 (G–I) in the anterior diencephalon. In the most rostral part of the diencephalon, hcrtr is mainly expressed in the ventral thalamic nucleus (vtn) and the ventral zone of the periventricular hypothalamus (hv) (A and B). Posteriorly, it is mostly expressed in the peripheral gray zone and in periventricular areas including the central posterior thalamic nucleus (cp) and the ventral zone of the periventricular hypothalamus. (J–L) Double ISH showing colocalization of hcrtr and adra2a in the ventral zone of the periventricular hypothalamus (arrowheads). (M–O) Double ISH showing colocalization of hcrtr and gad67 in the ventral zone of the periventricular hypothalamus and ventral thalamic nucleus (arrowheads). (P–R) Double ISH showing colocalization of gad67 and adra2a in the ventral zone of the periventricular hypothalamus (arrowheads). Note that hcrtr, gad67, and adra2a only colocalize in the anterior hypothalamus and not in the posterior ventral zone of the periventricular hypothalamus, where gad67 is absent (I). Posterior to this area, only the central thalamic nucleus expresses these three markers (last column).
Figure 7
Figure 7. hcrtr Does Not Colocalize with the Cholinergic System in the Telencephalon and Rhombencephalon
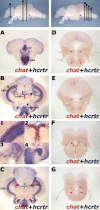
The topmost panels display lateral views of zebrafish adult brains with transversal planes corresponding to sections presented below. Results were all obtained using ISH with chat and hcrtr. (A) Cholinergic neurons were not detected in the adult zebrafish telencephalon using chat or vacht (data not shown). In this area, hcrtr is strongly expressed in the commissural nucleus of the ventral telencephalic area (cv) and the anterior part of the parvocellular preoptic nucleus (ppa). (B and C) Major clusters of cholinergic neurons are present in the periventricular gray zone (pgz) ([B], panel 1), the nucleus of the medial longitudinal fascicle (nmlf) ([B], panel 2), the perilemniscal nucleus (pl) ([B], panel 3), the dorsal zone of periventricular hypothalamus (hd) ([B], panel 4), and the nucleus lateralis valvulae (nlv) (C). Coexpression with hcrtr was mostly observed in the periventricular gray zone ([B], panel 1) and in the dorsal zone of periventricular hypothalamus ([B], panel 4). (D–G) A careful survey of the rhombencephalon failed to reveal coexpression of hcrtr with chat-positive neurons, including in the peri-locus coeruleus area.
Figure 8
Figure 8. Known Null Mutations of Zebrafish and Mammalian hcrtr Genes
Note the extremely high homology with mammalian HCRTR2 (71% identity with human HCRTR2). Z1: an HCRTR arginine to stop (“STOP”) was identified through TILLING. D1: an E54K substitution null allele previously identified in dog (dachshund). D2 and D3: positions of HCRTR2 frame shifts in dog (doberman, D2, and labrador, D3) were followed by 32 and two amino acids, respectively, before truncation.
Figure 9
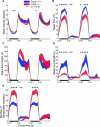
Figure 9. Sleep–Wake Patterns in hcrtr168 Mutants versus Wild-Type
Recordings were performed using the AFSRS over 48 h after 3 d of habituation. Data are plotted every 2 h. (Wild-type, n = 22; homozygous mutant, n = 17). (A) Activity patterns. Note slightly increased activity (+20%) in mutant fish during the night. (B) Percent sleep per hour. Note decreased sleep amounts (−30%) in mutant fish during the entire night. (C) Mean wake bout length per hour (calculated as the mean period length of the non-sleep periods each hour) is similar in both genotypes. (D) Mean sleep bout length per hour. Note dramatic decrease in sleep bout length (−65%) during the night in mutant animals. (E) The number of sleep–wake transitions per hour increases dramatically in hcrtr168 mutants during the night (+60%). For overall means of these parameters across the dark and light periods, and during other light cycles, see Table 1.
Figure 10
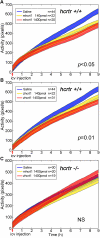
Figure 10. Effects of icv Injections of Hypocretin-1 on Activity in Wild-Type Zebrafish versus hcrtr168 Mutants
Injections were performed as described in Materials and Methods, 5–10 min prior to recordings. (A) Cumulative activity in wild-type fish over 9 h in the recording chamber after icv injection of saline (blue) or 140 (yellow) or 1,400 (red) pmol of mammalian hypocretin-1. The initial steep rise in activity is due to habituation to the novel environment. Note long-lasting, dose-dependent reduction of activity after 140- and 1,400-pmol injections. A dose-dependent significant decrease in locomotion was detected using multilinear analysis of variance with repeated measures with increasing hypocretin doses (p < 0.05) as grouping factors. (B) Cumulative activity in wild-type fish over 9 h after icv injection of saline (blue) or 140 (yellow) or 1,400 (red) pmol of zebrafish hypocretin-1. Note dose-dependent reduction of activity after 140- and 1,400-pmol injections, as observed after mammalian hypocretin-1. A dose-dependent significant decrease in locomotion was detected using multilinear analysis of variance with repeated measures with increasing hypocretin doses (p = 0.01) as grouping factors. (C) Cumulative activity in hcrtr168 mutants over 9 h after icv injection of saline (blue) or 1,400 pmol of mammalian (yellow) or zebrafish (red) hypocretin-1. Note absence of sedative effects after zebrafish or mammalian hypocretin-1 in hcrtr mutants, when compared to saline. n, number of animals tested at each dose.

Comment in

Similar articles

Cited by

References

    1. Tononi G, Cirelli C. Sleep function and synaptic homeostasis. Sleep Med Rev. 2006;10:49–62. - PubMed
    1. Siegel JM. Clues to the functions of mammalian sleep. Nature. 2005;437:1264–1271. - PMC - PubMed
    1. Joiner WJ, Crocker A, White BH, Sehgal A. Sleep in Drosophila is regulated by adult mushroom bodies. Nature. 2006;441:757–760. - PubMed
    1. Shaw PJ, Cirelli C, Greenspan RJ, Tononi G. Correlates of sleep and waking in Drosophila melanogaster . Science. 2000;287:1834–1837. - PubMed
    1. Cirelli C, Bushey D, Hill S, Huber R, Kreber R, et al. Reduced sleep in Drosophila Shaker mutants. Nature. 2005;434:1087–1092. - PubMed

Publication types

MeSH terms