. 2007 Dec;189(2):251-79.
doi: 10.1016/j.jmr.2007.09.013. Epub 2007 Sep 20.

250GHz CW gyrotron oscillator for dynamic nuclear polarization in biological solid state NMR

Affiliations

250GHz CW gyrotron oscillator for dynamic nuclear polarization in biological solid state NMR

Vikram S Bajaj et al. J Magn Reson. 2007 Dec.

Abstract

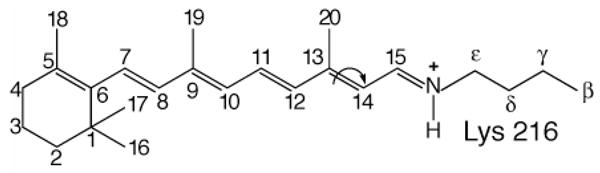
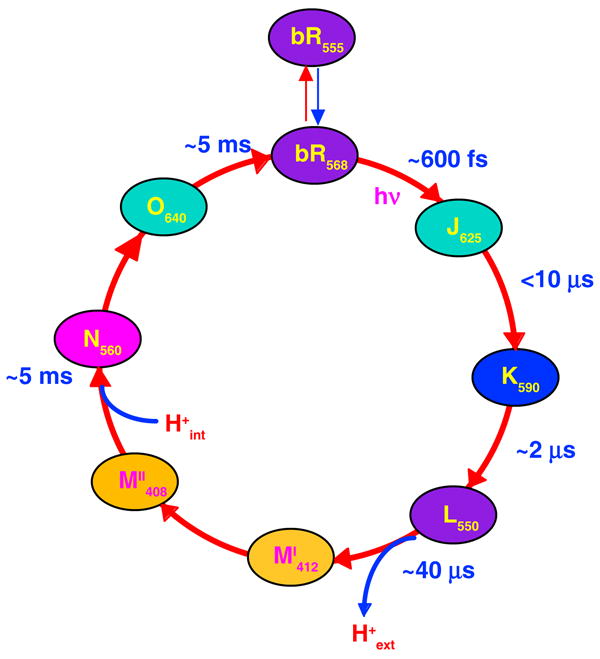
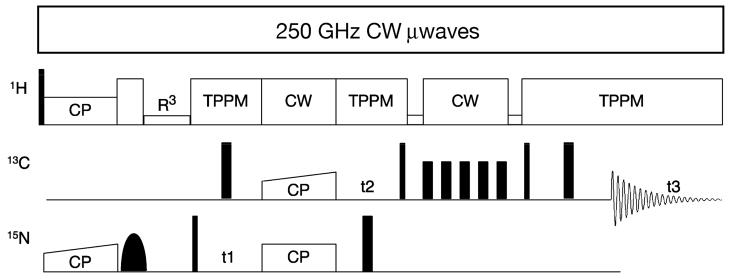
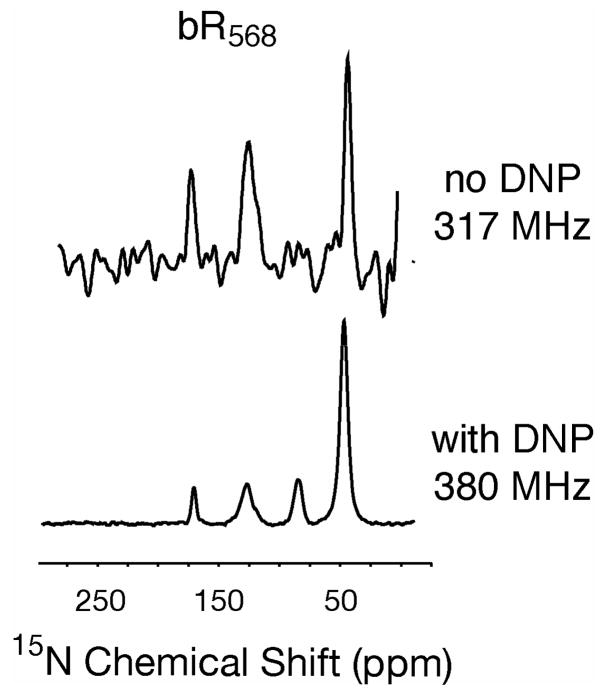
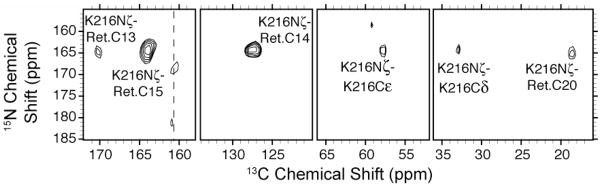
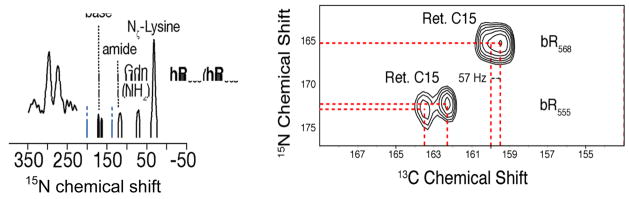
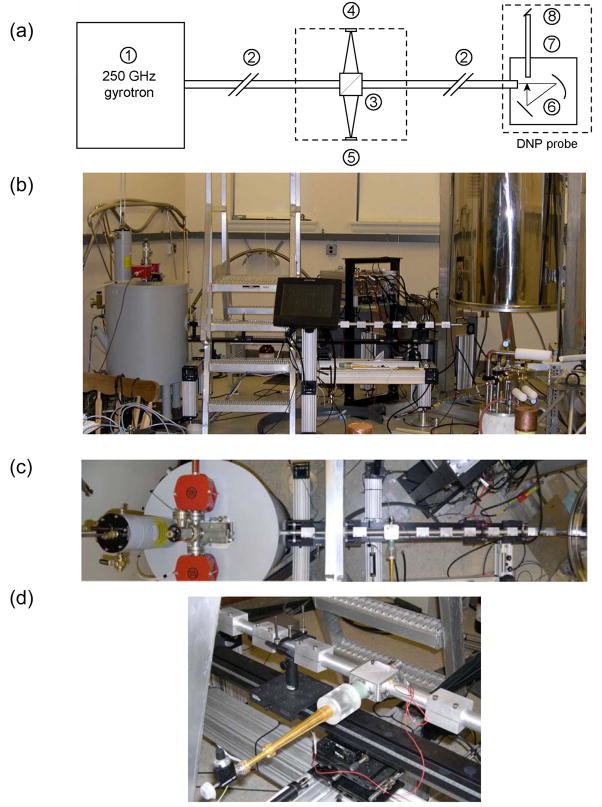
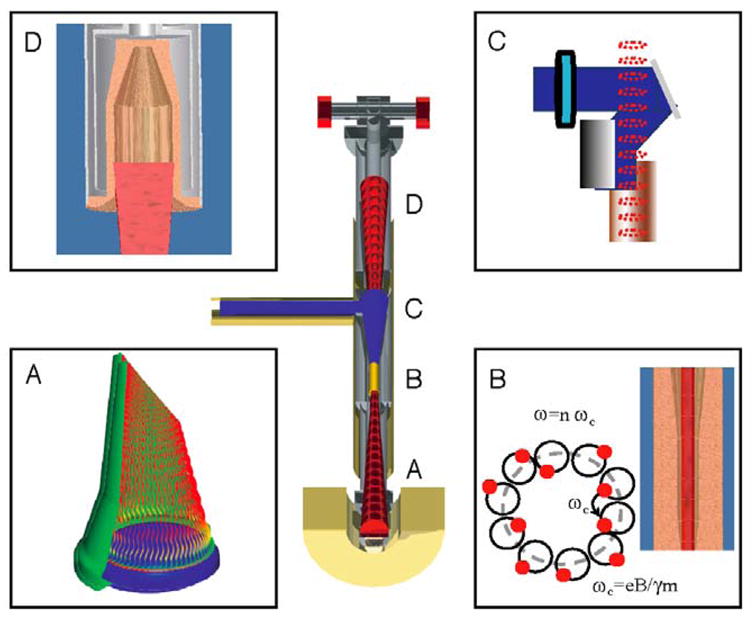
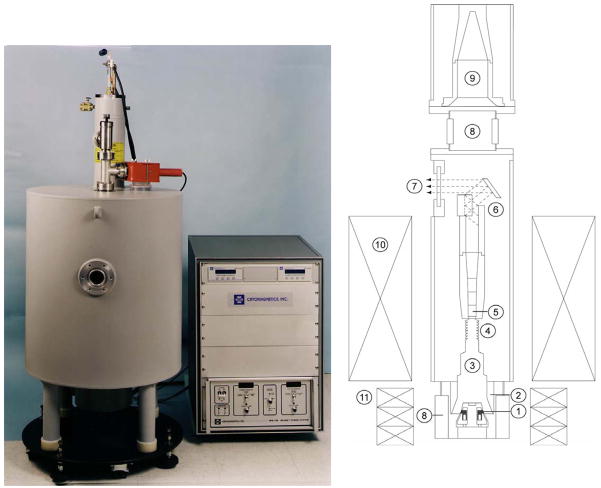
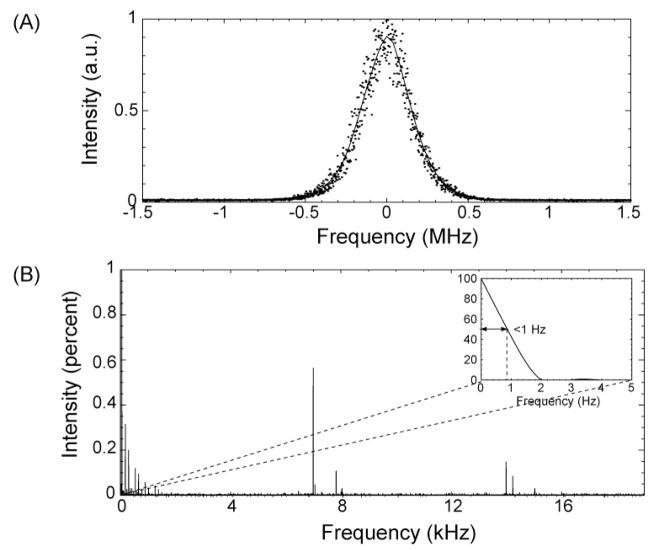
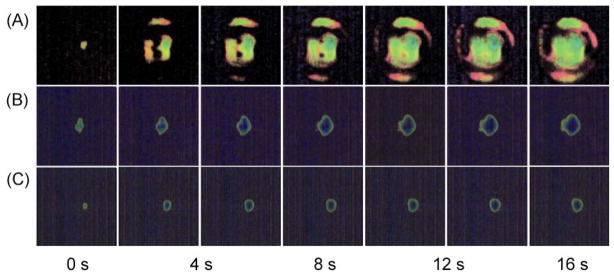
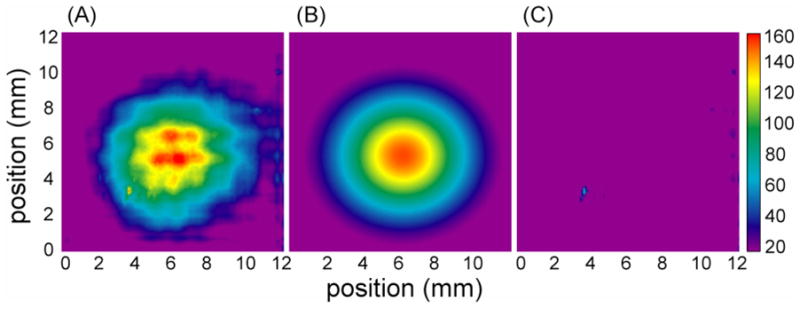
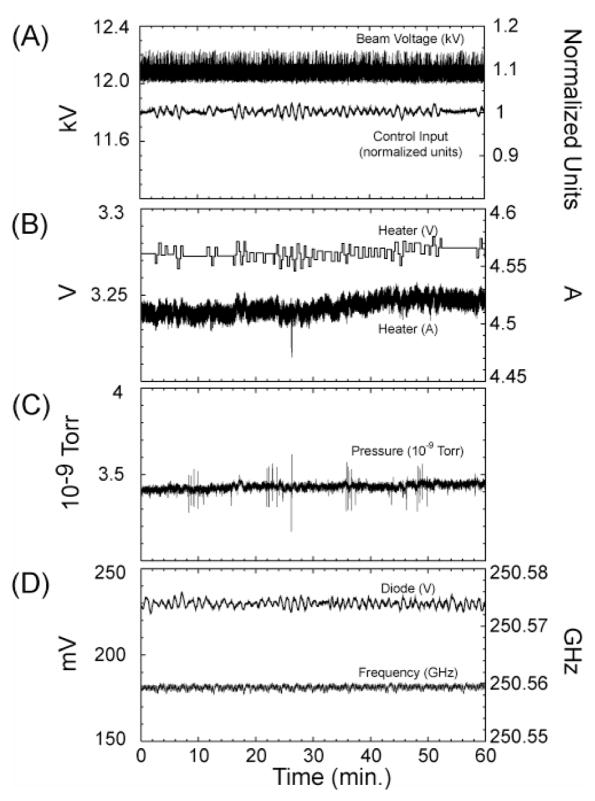
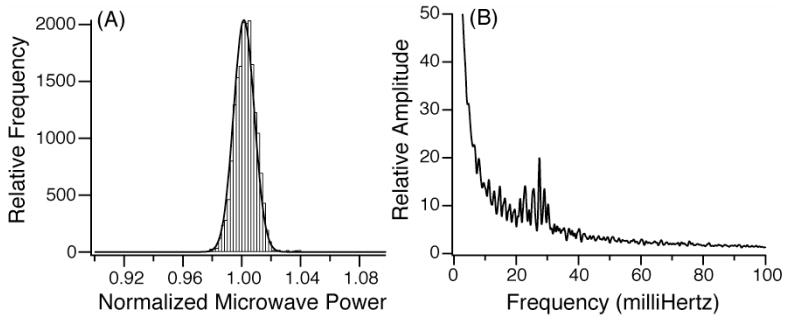
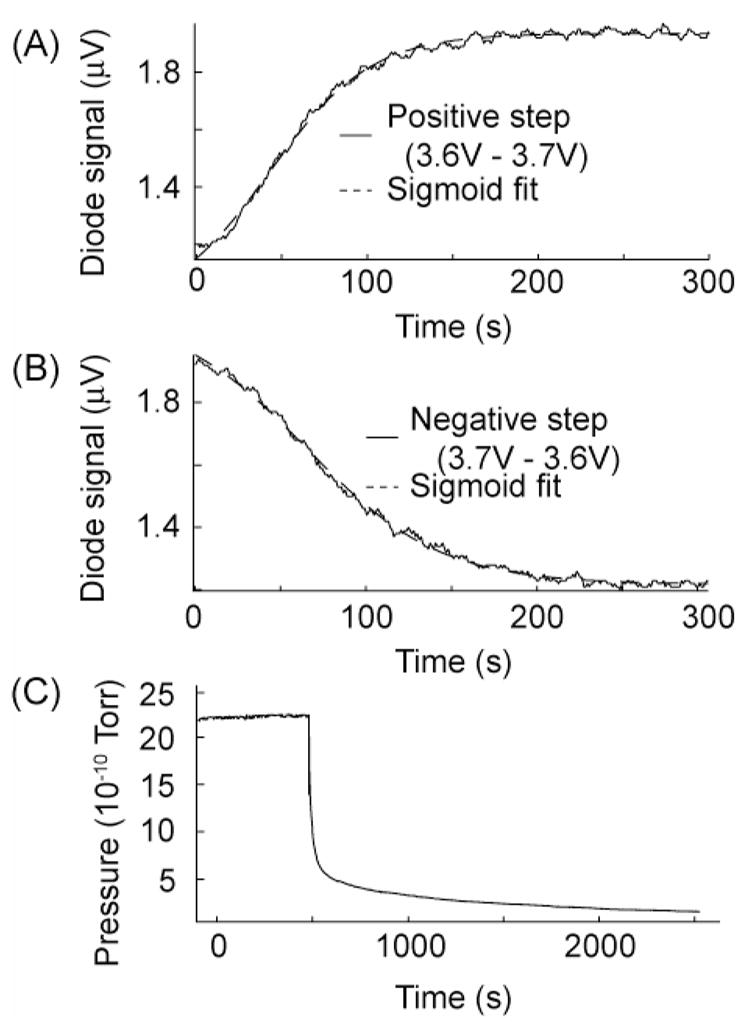
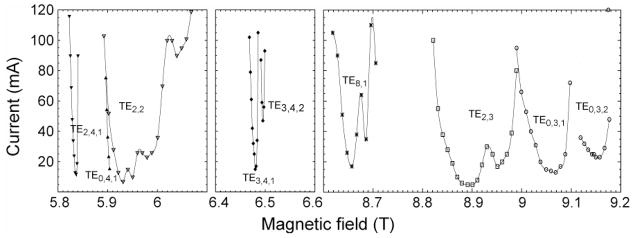
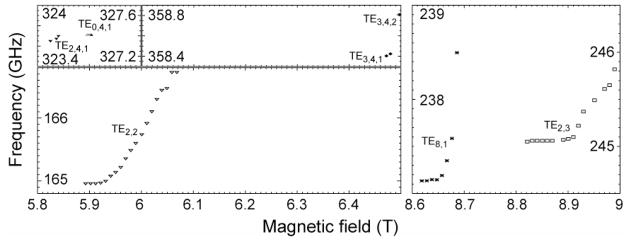
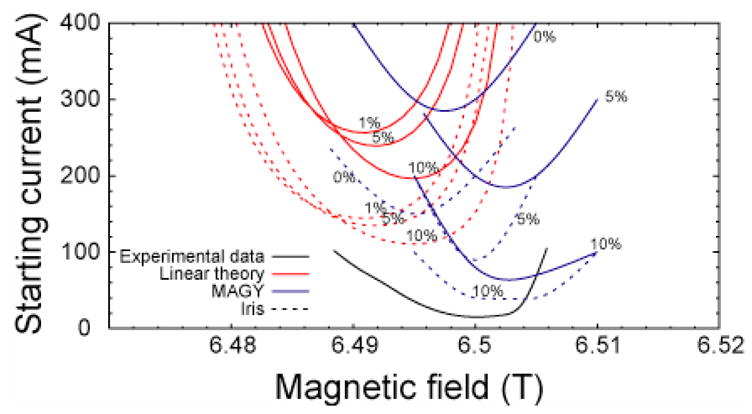
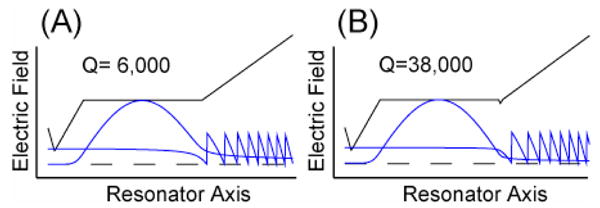
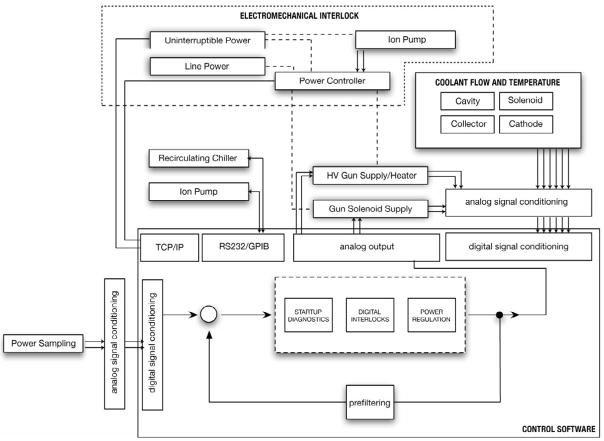
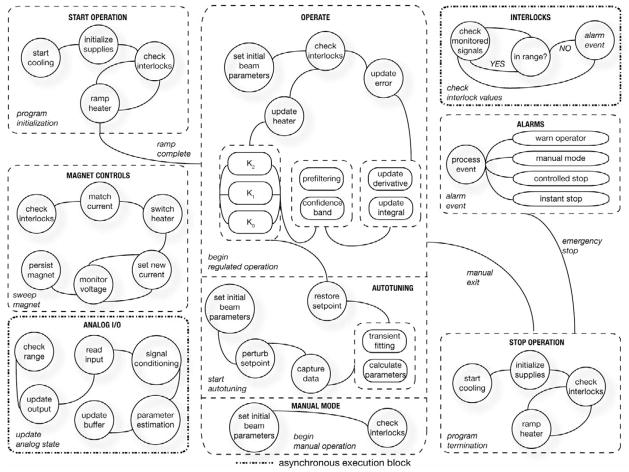
In this paper, we describe a 250 GHz gyrotron oscillator, a critical component of an integrated system for magic angle spinning (MAS) dynamic nuclear polarization (DNP) experiments at 9T, corresponding to 380 MHz (1)H frequency. The 250 GHz gyrotron is the first gyro-device designed with the goal of seamless integration with an NMR spectrometer for routine DNP enhanced NMR spectroscopy and has operated under computer control for periods of up to 21 days with a 100% duty cycle. Following a brief historical review of the field, we present studies of the membrane protein bacteriorhodopsin (bR) using DNP enhanced multidimensional NMR. These results include assignment of active site resonances in [U-(13)C, (15)N]-bR and demonstrate the utility of DNP for studies of membrane proteins. Next, we review the theory of gyro-devices from quantum mechanical and classical viewpoints and discuss the unique considerations that apply to gyrotron oscillators designed for DNP experiments. We then characterize the operation of the 250 GHz gyrotron in detail, including its long-term stability and controllability. We have measured the spectral purity of the gyrotron emission using both homodyne and heterodyne techniques. Radiation intensity patterns from the corrugated waveguide that delivers power to the NMR probe were measured using two new techniques to confirm pure mode content: a thermometric approach based on the temperature-dependent color of liquid crystalline media applied to a substrate and imaging with a pyroelectric camera. We next present a detailed study of the mode excitation characteristics of the gyrotron. Exploration of the operating characteristics of several fundamental modes reveals broadband continuous frequency tuning of up to 1.8 GHz as a function of the magnetic field alone, a feature that may be exploited in future tunable gyrotron designs. Oscillation of the 250 GHz gyrotron at the second harmonic of cyclotron resonance begins at extremely low beam currents (as low 12 mA) at frequencies between 320 and 365 GHz, suggesting an efficient route for the generation of even higher frequency radiation. The low starting currents were attributed to an elevated cavity Q, which is confirmed by cavity thermal load measurements. We conclude with an appendix containing a detailed description of the control system that safely automates all aspects of the gyrotron operation.


Figures

Figure 1
Figure 1
Nomenclature of 13C sites of the retinal chromophore and the Lys 216 side chain to which it is covalently attached. The arrow indicates that during the bR photocycle there is isomerization about the C13–C14 bond. In light-adapted bR the retinal is in an all-trans conformation and the Schiff base nitrogen is protonated, whereas in dark adapted bR, three retinal conformations are present as shown by the DNP enhanced spectra in Figure 2 (vide infra).
Figure 2
Figure 2
Intermediates in the bR photocycle. Deprotonation of the Schiff base occurs in the L to M transition, a switch in the accessibility of the Schiff base from the cytoplasmic to the extracellular side of the protein occurs between the early and late M states, and reprotonation of the Schiff base occurs in the M to N transition. The subscripts reflect the absorption maxima of the photocycle intermediates and the times indicate the approximate lifetimes of the states.
Figure 3
Figure 3
Pulse sequence for a 2D 15N-13C-13C heteronuclear correlation experiment incorporating DNP. The EPR spectrum is continuously irradiated with 4–5 watts of microwave power yielding a steady state enhanced 1H polarization that is replenished during the recycle delay of the NMR experiment. Following 1H-15N cross-polarization, magnetization is labeled with the 15N chemical shift and then transferred to the 13C spins using band-selective 15N-13C cross polarization. Further homonuclear mixing is accomplished with a dipolar recoupling sequence such as RFDR or by proton-driven spin diffusion in the presence of an R3 recoupling field (DARR/RAD) [–85]
Figure 4
Figure 4
One dimensional 1H decoupled 15N MAS spectra of light adapted ζ-15N-Lys-bR. Top: Spectrum acquired on a 317 MHz spectrometer using a 5 mm ZrO2 rotor with a 160 μl sample volume, 10,000 scans, 3.5 days (~5000 min) of data acquisition, T=200K Bottom: Spectrum acquired with DNP -- 250 GHz microwave irradiation using a 4 mm sapphire rotor, 40 μl, T=90K, 384 scans, 30 minutes of data acquisition. The assignment of the lines in the spectra (left to right) are: 165 ppm --protonated Schiff base 15N; 130 ppm – natural abundance amide backbone; 80 ppm – natural abundance guanidine-HCl (only present in the 380 MHz spectrum); 50 ppm – six free ζ-15N-Lys signals in bR. ωr/2π ~ 7 kHz.
Figure 5
Figure 5
Schiff base region of 2D Lys-Nζ-Ret.-C15-CX correlation spectrum of [U-13C, 15N]-bR in the light adapted state (bR568). Multiple chemical shift assignments result from a single experiment. ωr/2π ~ 7 kHz.
Figure 6
Figure 6
(left) 1D spectra of ζ-15N-Lys-bR in the dark adapted state (a mixture of bR555 and bR568) with Schiff base region shown in the inset. (right) 2D Lys-Nζ-Ret.-C15-CX correlation spectrum obtained from [U-13C, 15N]-bR in the dark adapted state. Note the presence of multiple conformers of bR555 that are not visible in the 1D spectra and partial resolution of the J-doublet in C15 of bR568. The acquisition time for the 2D spectrum was 2.75 hours. ωr/2π ~ 7 kHz.
Figure 7
Figure 7
(a) Schematic representation of the 250 GHz gyrotron, corrugated transmission system, and 380 MHz NMR probe. (1) 250 GHz gyrotron oscillator (2) Corrugated waveguide (22 mm i.d.). (3) Beam splitter; (4) Forward power detector; (5) Reflected power detector; (6) Focusing and reflecting mirror optics; (7) Helically corrugated waveguide (8 mm i.d.); and (8) Miter mirror. (b) Photograph of the 250 GHz DNP experiment. The gyrotron magnet, on the left, is interfaced to a corrugated waveguide which leads to the NMR magnet, on the right. A touch-sensitive control interface is located midway on the waveguide support and alignment system. (c) Composite photograph of the system illustrated schematically in Figure 7a (left) 250 GHz gyrotron the gyrotron tube is shown with vacion pumps in the gray superconducting magnet, (center) corrugated transmission system with the directional coupler visible in the center of the photograph, and (right) 380 MHz NMR magnet is visible on the edge of the photo. The NMR probe is not visible since it is under the magnet. The view in this photo is from above the gyrotron and waveguide looking down. (d): Photograph of the 250 GHz quasi-optical directional coupler. Forward power is coupled to the detector diode by means of a short dielectric taper, dielectric horn, and a circular-to-rectangular transition. An attenuator allows the power to be adjusted to the linear range of the diode. The detection circuit has been designed with high loss to avoid reflections across the beam splitter.
Figure 8
Figure 8
Schematic representation of the four major sections of a gyrotron tube that resides in the bore of a superconducting solenoid (see Figure 9). The central figure illustrates the assembled gyrotron tube and the four panels the function of each of the major sections. (A) shows the annular cathode of the electron gun from which the electrons are emitted forming beamlets and the cyclotron motion that initiates as a result of the presence of the magnetic field. The red dots represent cross sections of the beamlets and a given point in time. In addition, the magnetic field adiabatically compresses the electron beamlets so that they are focused into the cavity with a radius optimized to interact with the cavity mode. (B) illustrates the cavity region where electron bunching occurs that leads to microwave generation. The electrons are depicted in the initial stage of the dephasing process. The Cu colored piece is the cavity which is tapered at the bottom and flared at the upper end. (C) shows the quasi-optical mode converter (consisting of a step-cut waveguide and steering mirror) that extracts the microwave beam and directs it an angle of 90° through the cross bore of the magnet and into the waveguide for sample irradiation. Note the spent electron beam (red dots) continues through the tube to the collector region. In (D) the electron beam (in red) is collected in a water-cooled collector.
Figure 9
Figure 9
(left) photograph of the 250 GHz gyrotron and the superconducting magnet power supply. The high voltage/heater power supply and control electronics are hosted in an additional rack similar to the magnet power supply. (right) Schematic of a gyrotron tube indicating the key components. (1) cathode; (2) anode; (3) drift tunnel; (4) microwave absorber; (5) cylindrical resonant cavity; (6) quasi-optical mode converter; (7) output window; (8) high voltage ceramic insulator; (9) electron beam collector; (10) persistent superconducting magnet; (11) electromagnet.
Figure 10
Figure 10
The uncoupled dispersion relations for the electron beam (cyclotron mode) and the waveguide mode (waveguide dispersion). Cyclotron maser emission can occur when the two modes coincide, as shown in the figure by the arrow at gyrotron resonance.
Figure 11
Figure 11
The energy spectrum of a relativistic gyrating electron showing the nonuniform spacing of the energy levels.
Figure 12
Figure 12
The energy absorption, W, (in arbitrary units) of an electron passing through a uniform resonator, as a function of the detuning from resonance. The plots are shown for different values of the parameter F. Significant energy emission ( E < 0 ) requires a value of F~2. F increases with both the electron energy (electrons that are more relativistic) and the number of cyclotron orbits in the interaction region.
Figure 13
Figure 13
Schematic of the cross section of a gyrotron interaction region at the resonator, showing the annular electron beam of radius rb, consisting of electron beamlets of is the azimuthal radius rL. rw specifies the radius of the resonator and ξθ is the azimuthal electric field.
Figure 14
Figure 14
The sequence of bunching, its evolution and eventual energy extraction in a gyrotron [108]. (a) Electrons randomly distributed in phase space, (b) and (c) the E field accelerates half the electrons (d) electrons end up as a bunch in the decelerating phase.
Figure 15
Figure 15
(A) Frequency and power of the operating TE0,3,2 mode as a function of magnetic field. (B) Power in the TE0,3,2 mode as a function of beam current. Power measurements were performed with a Scientech laser calorimeter that has been calibrated for millimeter waves.
Figure 16
Figure 16
Frequency pulling in the TE0,3,2 mode as a function of (A) the main magnetic field, (B) the gun magnetic field, and (C) the beam voltage. Simulations (solid lines in the figures) were conducted in MAGY [112]
Figure 17
Figure 17
(a) Linewidth measurement of the operating TE0,3,2 mode using the heterodyne frequency measurement system. (b) Homodyne measurement in TE0,3,2 mode. The offset panel illustrates the natural emission linewidth.
Figure 18
Figure 18
Radiated intensity of the gyrotron output while operating in the TE0,3,2 mode as recorded on liquid crystal media for (a) at the gyrotron bore and (b) after 120 cm of waveguide and (c) after 200 cm of corrugated waveguide as described in the text.
Figure 19
Figure 19
Planar section of the radiation intensity as recorded by a pyroelectric camera. (A) is the intensity 190 cm along the waveguide axis (B) is a Gaussian fit of the intensity data and (C) is the residual of the fit. The intensity is described on a linear scale in arbitrary units.
Figure 20
Figure 20
Stability of the TE0,3,2 operating mode over a representative hour of a long experiment. (A) beam voltage and control input, (B) heater voltage and current, (C) pressure, and (D) power and frequency. These parameters were measured with the directional coupler shown in Figure 7D as described in the text.
Figure 21
Figure 21
(a) Statistical analysis of power fluctuations from setpoint. The solid line is a Gaussian fit to the data. The control system was set to maintain the output power within a 1% tolerance. (b) Frequency-domain analysis of power fluctuations from the setpoint.
Figure 22
Figure 22
Representative transient response of the gyrotron to (A) positive and (B) negative step in the control voltage. The dashed line is a sigmoidal fit to the data from which optimal PID parameters were estimated. Note oscillations in the output power which persist even though the system is not under proportional regulation for these measurements. (C) Response of the system to termination of running power supplies following thirteen hours of CW operation.
Figure 23
Figure 23
Summary of experimental starting current data recorded for resonant cavity modes from 5.8 to 9.2 T and up to 120 mA. Open symbols denote fundamental modes and solid symbols denote second harmonic modes.
Figure 24
Figure 24
Summary of experimental frequency tuning data recorded for resonant cavity modes from 5.8 to 9 T near their starting currents. Open symbols denote fundamental modes and solid symbols denote second harmonic modes.
Figure 25
Figure 25
Starting currents for the second harmonic TE3,4,1 mode using linear and non-linear theory and for the case of the design cavity (lines) and with an iris added before the output uptaper (dotted lines). The percentages indicate the velocity spread simulated.
Figure 26
Figure 26
Cold cavity simulation showing the cavity and RF profile for the 250 GHz gyrotron cavity (a) without and (b) with an iris.
Figure A1
Figure A1
Block diagram illustrating major components of the 250 GHz gyrotron control system.
Figure A2
Figure A2
State machine indicating common processing functionality of the 250 GHz control system. Transitions between blocks occur in response to events passed through a global message queue and are not explicitly illustrated. Each block has access to a global variable space and message queue, and concurrent execution blocks are indicated. Analog I/O is blocking.

References

    1. Ernst RR, Anderson WA. Application of Fourier Transform Spectroscopy to Magnetic Resonance. Review of Scientific Instruments. 1966;37:93–102.
    1. Styles P, Soffe N, Scott C, Cragg D, Row F, White D, White P. A High-Resolution NMR Probe in Which the Coil and Preamplifier are Cooled with Liquid Helium. Journal of Magnetic Resonance. 1984;60:397–404. - PubMed
    1. Hartmann SR, Hahn EL. Double Resonance in the Rotating frame. Phys Rev. 1962;128:2042–2053.
    1. Pines A, Gibby MG, Waugh JS. Proton-enhanced NMR of dilute spins in solids. J Chem Phys. 1973;59:569–590.
    1. Morris G, Freeman R. Enhancement of Nuclear Magnetic Resonance Signals by Polarization Transfer. J Am Chem Soc. 1979;101:760–762.

MeSH terms

Substances

LinkOut - more resources