

Deaminase-independent inhibition of HIV-1 reverse transcription by APOBEC3G
- PMID: 17942420
- PMCID: PMC2175344
- DOI: 10.1093/nar/gkm750
Deaminase-independent inhibition of HIV-1 reverse transcription by APOBEC3G
Abstract
APOBEC3G (A3G), a host protein that inhibits HIV-1 reverse transcription and replication in the absence of Vif, displays cytidine deaminase and single-stranded (ss) nucleic acid binding activities. HIV-1 nucleocapsid protein (NC) also binds nucleic acids and has a unique property, nucleic acid chaperone activity, which is crucial for efficient reverse transcription. Here we report the interplay between A3G, NC and reverse transcriptase (RT) and the effect of highly purified A3G on individual reactions that occur during reverse transcription. We find that A3G did not affect the kinetics of NC-mediated annealing reactions, nor did it inhibit RNase H cleavage. In sharp contrast, A3G significantly inhibited all RT-catalyzed DNA elongation reactions with or without NC. In the case of (-) strong-stop DNA synthesis, the inhibition was independent of A3G's catalytic activity. Fluorescence anisotropy and single molecule DNA stretching analyses indicated that NC has a higher nucleic acid binding affinity than A3G, but more importantly, displays faster association/disassociation kinetics. RT binds to ssDNA with a much lower affinity than either NC or A3G. These data support a novel mechanism for deaminase-independent inhibition of reverse transcription that is determined by critical differences in the nucleic acid binding properties of A3G, NC and RT.
Figures
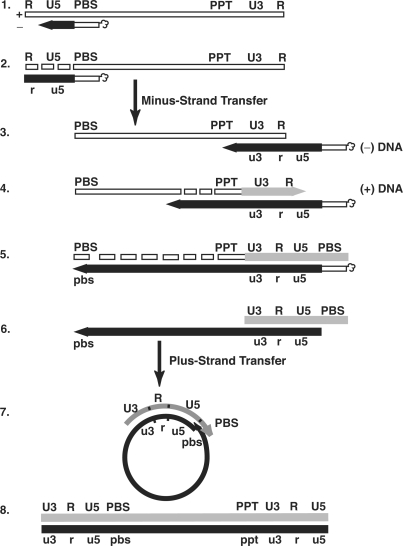
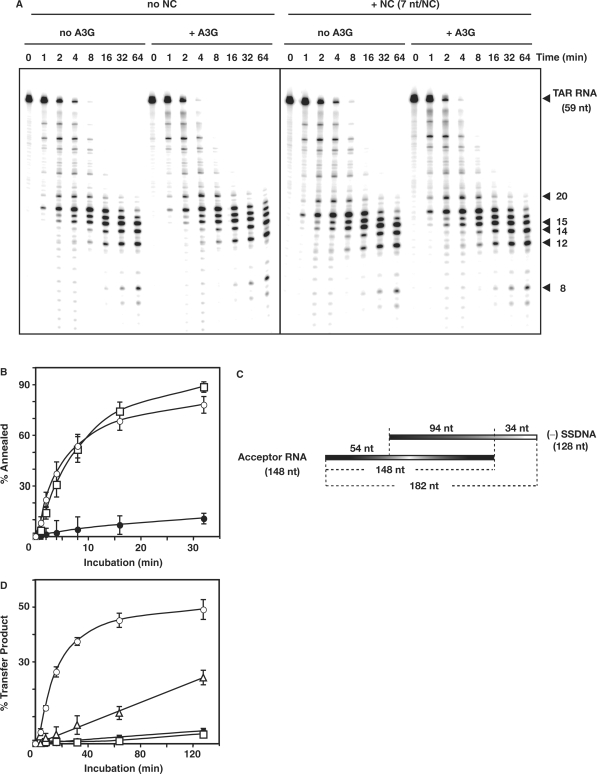
 , in the case of HIV-1), following annealing of the 3′ 18 nt of the tRNA to the 18-nt PBS near the 5′ end of the genome. RT catalyzes synthesis of (−) SSDNA, which contains copies of the R sequence and the unique 5′ genomic sequence (U5). Step 2. As the primer is extended, the RNase H activity of RT degrades the genomic RNA sequences that have been reverse transcribed. Step 3. (−) SSDNA is transferred to the 3′ end of vRNA (minus-strand transfer). Step 4. Elongation of minus-strand DNA and RNase H degradation continue. Plus-strand synthesis is initiated by the 15-nt PPT immediately upstream of the unique 3′ genomic sequence (U3). Step 5. RT copies the u3, u5 and r regions in minus-strand DNA, as well as the 3′ 18 nt of the tRNA primer, thereby reconstituting the PBS. The product formed is termed (+) SSDNA. Step 6. RNase H removal of the tRNA and PPT primers from minus- and plus-strand DNAs, respectively. Step 7. Plus-strand transfer, facilitated by annealing of the complementary PBS sequences at the 3′ ends of (+) SSDNA and minus-strand DNA, is followed by circularization of the two DNA strands and displacement synthesis. Step 8. Minus- and plus-strand DNAs are elongated, resulting in a linear dsDNA with a long terminal repeat (LTR) at each end. vRNA is shown by an open rectangle and minus-and plus-strand DNAs are shown by black and gray rectangles, respectively. The tRNA primer is represented by a short open rectangle (3′ 18 nt of the tRNA) attached to a ‘clover-leaf’ (remaining tRNA bases). Minus- and plus-strand sequences are depicted in lower and upper case, respectively. The very short white rectangles represent fragments produced by RNase H cleavage of genomic RNA. Adapted from reference (43) with permission from Elsevier.
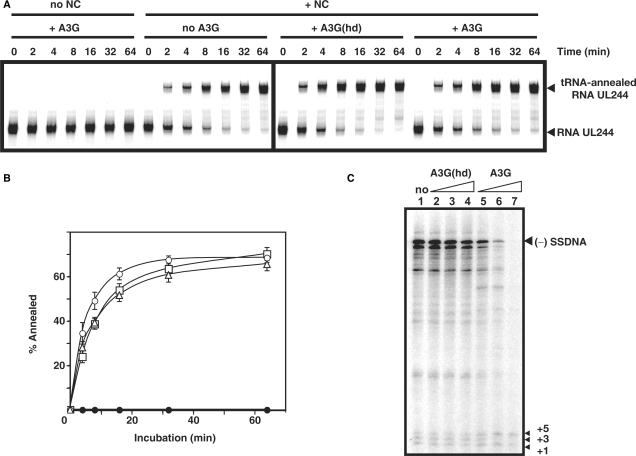 -primed (−) SSDNA synthesis. (A) Time course of annealing to RNA UL244. Reactions were performed in the absence or presence of NC and A3G, as indicated by the headings at the top of the gel. The positions of the RNA UL244 template and the annealed RNA duplex are shown on the right. (B) The percentage of annealed product was calculated by dividing the amount of annealed RNA by the sum of annealed plus unannealed RNA, multiplied by 100. Symbols: no NC/no A3G (filled circles); +NC/no A3G (open squares); +NC/+hdA3G (open circles); and +NC/+A3G (open triangles). (C) A /RNA 244 complex was extended by HIV-1 RT in the absence (lane 1) or presence of hdA3G (lanes 2–4) or A3G (lanes 5–7). The positions of (−) SSDNA and initial pause products at bases +1, +3 and +5 are shown on the right. A3G concentrations: lane 1, 0 nM; lanes 2 and 5, 20 nM; lanes 3 and 6, 40 nM; lanes 4 and 7, 80 nM.
References
-
- Sheehy A.M., Gaddis N.C., Choi J.D., Malim M.H. Isolation of a human gene that inhibits HIV-1 infection and is suppressed by the viral Vif protein. Nature. 2002;418:646–650. - PubMed
-
- Ehrlich E.S., Yu X.F. Lentiviral Vif: viral hijacker of the ubiquitin-proteasome system. Int. J. Hematol. 2006;83:208–212. - PubMed
-
- Harris R.S., Bishop K.N., Sheehy A.M., Craig H.M., Petersen-Mahrt S.K., Watt I.N., Neuberger M.S., Malim M.H. DNA deamination mediates innate immunity to retroviral infection. Cell. 2003;113:803–809. - PubMed
-
- Lecossier D., Bouchonnet F., Clavel F., Hance A.J. Hypermutation of HIV-1 DNA in the absence of the Vif protein. Science. 2003;300:1112. - PubMed
-
- Mangeat B., Turelli P., Caron G., Friedli M., Perrin L., Trono D. Broad antiretroviral defence by human APOBEC3G through lethal editing of nascent reverse transcripts. Nature. 2003;424:99–103. - PubMed
