. 2008 Jan;19(1):65-77.
doi: 10.1091/mbc.e07-06-0525. Epub 2007 Oct 17.

p21 Inhibits Cdk1 in the absence of Cdk2 to maintain the G1/S phase DNA damage checkpoint

Affiliations

p21 Inhibits Cdk1 in the absence of Cdk2 to maintain the G1/S phase DNA damage checkpoint

Ande Satyanarayana et al. Mol Biol Cell. 2008 Jan.

Abstract

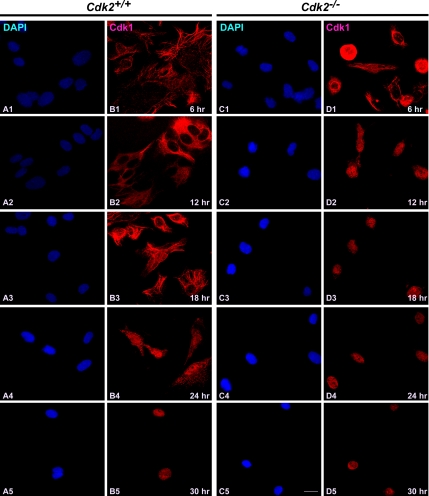
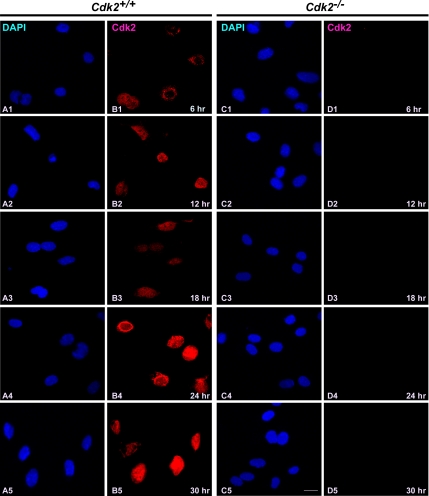
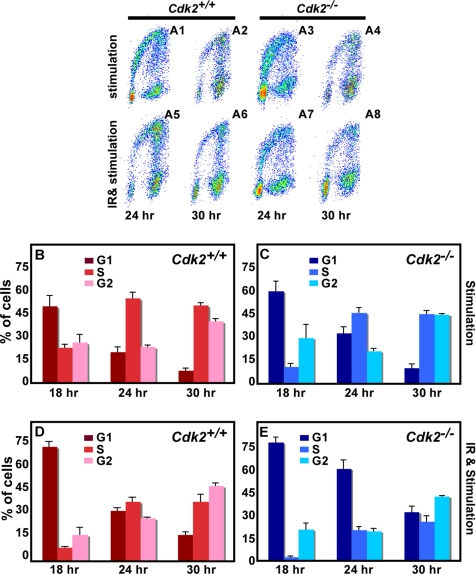
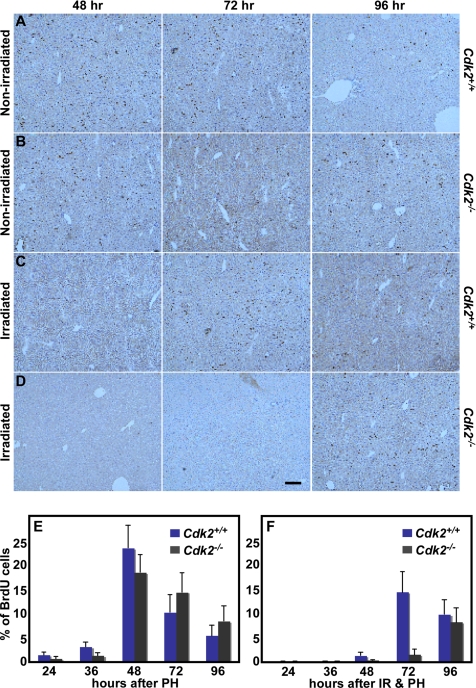
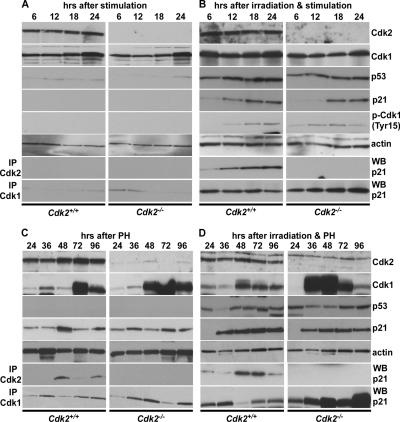
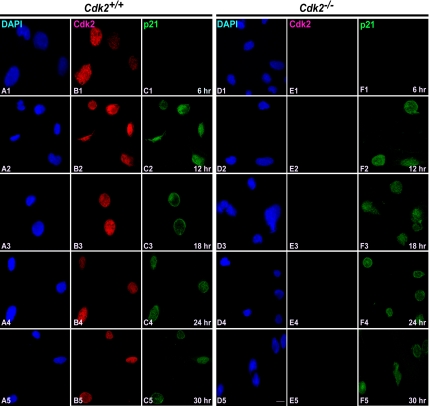
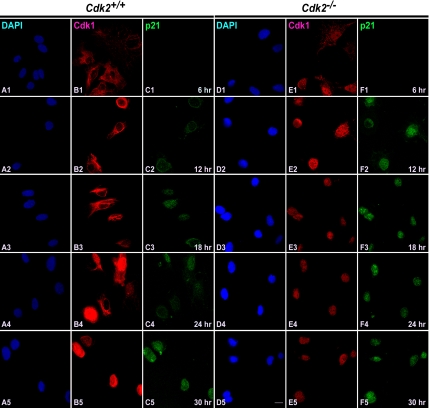
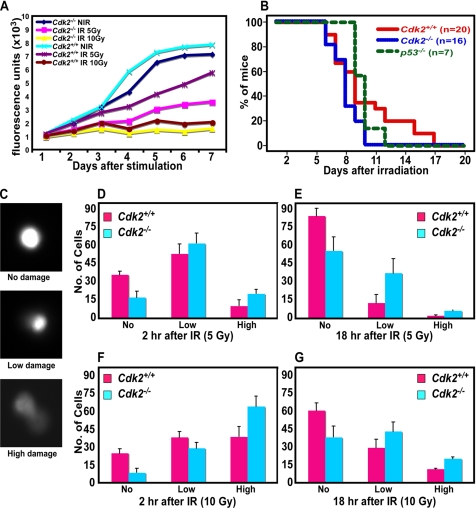
Cdk1 was proposed to compensate for the loss of Cdk2. Here we present evidence that this is possible due to premature translocation of Cdk1 from the cytoplasm to the nucleus in the absence of Cdk2. We also investigated the consequence of loss of Cdk2 on the maintenance of the G1/S DNA damage checkpoint. Cdk2(-/-) mouse embryonic fibroblasts in vitro as well as regenerating liver cells after partial hepatectomy (PH) in Cdk2(-/-) mice, arrest promptly at the G1/S checkpoint in response to gamma-irradiation due to activation of p53 and p21 inhibiting Cdk1. Furthermore re-entry into S phase after irradiation was delayed in Cdk2(-/-) cells due to prolonged and impaired DNA repair activity. In addition, Cdk2(-/-) mice were more sensitive to lethal irradiation compared to wild-type and displayed delayed resumption of DNA replication in regenerating liver cells. Our results suggest that the G1/S DNA damage checkpoint is intact in the absence of Cdk2, but Cdk2 is important for proper repair of the damaged DNA.


Figures

Figure 1.
Figure 1.
Cdk1 translocates early to the nucleus in the absence of Cdk2. Immunocytochemical staining of Cdk1 in Cdk2+/+ and Cdk2−/− MEFs at different time points after serum stimulation. Localization of Cdk1 was detected by rabbit anti-Cdk1 antibodies followed by AlexaFluor568 goat anti-rabbit antibodies (red; B1–B5 and D1–D5), and the nuclei were counterstained with DAPI (blue; A1–A5 and C1–C5). The images were captured with a laser confocal microscope (63×). The representative pictures are from one of three independent stainings. Scale bar, 10 μm in every panel.
Figure 2.
Figure 2.
Cdk2 resides predominantly in the nucleus irrespective of cell cycle stage. Immunofluorescence staining of Cdk2 in serum-stimulated Cdk2+/+ and Cdk2−/− MEFs at different time points. Cdk2 localization was detected by rabbit anti-Cdk2 antibodies followed by AlexaFluor568 goat anti-rabbit antibodies (red; B1–B5 and D1–D5) and the nuclei were counterstained with DAPI (blue; A1–A5 and C1–C5). The images were captured with a laser confocal microscope (63×). The representative pictures are from one of three independent stainings. Scale bar, 10 μm in every panel.
Figure 3.
Figure 3.
Cells arrest at the G1/S checkpoint in vitro in the absence of Cdk2. (A) Flow cytometric analysis of Cdk2+/+ and Cdk2−/− MEFs after serum stimulation alone and 5-Gy γ-irradiation and serum stimulation after 24 and 30 h. The cells were stained with propidium iodide and anti-BrdU AlexaFluor488 antibodies. Representative dot plots are from one of three independent cell cycle profiles. (B) Bar graph representing the percentage of Cdk2+/+ MEFs in G1 (red), S (fuchsia), and G2 (pink) phases of the cell cycle after serum stimulation at the indicated time points. (C) Bar graph presenting the percentage of Cdk2−/− MEFs in G1 (navy blue), S (blue), and G2 (aqua) phases of the cell cycle after serum stimulation at the indicated time points. (D) Bar graph presenting the percentage of Cdk2+/+ MEFs in G1 (red), S (fuchsia), and G2 (pink) phases of the cell cycle after 5-Gy irradiation and serum stimulation at the indicated time points. (E) Bar graph presenting the percentage of Cdk2−/− MEFs in G1 (navy blue), S (blue), and G2 (aqua) phases of the cell cycle after 5-Gy irradiation and serum stimulation at the indicated time points. For all graphs the average and SDs were acquired from three independent experiments.
Figure 4.
Figure 4.
Cells arrest at the G1/S checkpoint in vivo in the absence of Cdk2. Representative photographs of immunohistochemical BrdU staining pattern in the regenerating livers of nonirradiated Cdk2+/+ mice (A), nonirradiated Cdk2−/− mice (B), irradiated Cdk2+/+ mice (C), and irradiated Cdk2−/− mice (D) at the indicated time points. Scale bar, 100 μm in all panels. (E) Bar graph showing the percentage of BrdU-positive liver cells at the indicated time points in the regenerating livers of Cdk2+/+ (navy blue) and Cdk2−/− (black) mice after 70% PH. (F) Bar graph indicating the percentage of BrdU-positive liver cells at different time points in the whole body–irradiated and regenerating livers of Cdk2+/+ (navy blue) and Cdk2−/− (black) mice after 70% PH. The average and SDs were calculated after counting a minimum of 2500 nuclei from several low power fields per sample from each genotype. For each time point 3 (24 and 36 h) or 4 (48, 72, and 96 h) Cdk2+/+ and Cdk2−/− mice were used.
Figure 5.
Figure 5.
p21 inhibits Cdk1 to arrest cells at the G1/S checkpoint in the absence of Cdk2. Representative Western blots displaying the expression of Cdk2, Cdk1, p53, p21, phospho-Cdk1-(Tyr15), actin (1st to 6th panel from top), and Cdk2-p21 and Cdk1-p21 coimmunoprecipitations (7th and 8th panel) in nonirradiated Cdk2+/+ (left panel) and Cdk2−/− (right panel) MEFs (A) and 5-Gy irradiated Cdk2+/+ (left column) and Cdk2−/− (right column) MEFs (B) and from nonirradiated Cdk2+/+ (left column) and Cdk2−/− (right column) regenerating livers (C) and from irradiated Cdk2+/+ (left column) and Cdk2−/− (right column) regenerating livers (D) at the indicated time points. Actin (5th panel) was used as a loading control.
Figure 6.
Figure 6.
Loss of Cdk2 does not influence the induction of p21. Immunofluorescence costaining of Cdk2 and p21 in 5-Gy irradiated and serum-stimulated Cdk2+/+ and Cdk2−/− MEFs at the indicated time points. Cdk2 localization was detected by rabbit anti-Cdk2 antibodies followed by AlexaFluor568 goat anti-rabbit antibodies in Cdk2+/+ cells (red; B1–B5) and in Cdk2−/− cells (red; E1–E5). p21 was detected by mouse anti p21 antibodies followed by AlexaFluor488 goat anti-mouse antibodies in Cdk2+/+ cells (green; C1–C5) and Cdk2−/− cells (green; F1–F5). The nuclei were counterstained with DAPI (blue; A1–A5 and D1–D5). The images were captured with a laser confocal microscope (63×). The representative pictures are from one of three independent stainings. Scale bar, 10 μm in all panels.
Figure 7.
Figure 7.
Cdk1 and p21 localize to the nucleus in the absence of Cdk2. Immunocytochemical costaining of Cdk1 and p21 in 5-Gy irradiated and serum-stimulated Cdk2+/+ and Cdk2−/− MEFs at the indicated time points. Cdk1 localization was detected by rabbit anti-Cdk1 antibodies followed by AlexaFluor568 goat anti-rabbit antibodies in Cdk2+/+ cells (red; B1–B5) and in Cdk2−/− cells (red; E1–E5). p21 was detected by mouse anti-p21 antibodies followed by AlexaFluor488 goat anti-mouse antibodies in Cdk2+/+ cells (green; C1–C5) and Cdk2−/− cells (green; F1–F5). The nuclei were counterstained with DAPI (blue; A1–A5 and D1–D5). The images were captured with a laser confocal microscope (63×). The representative pictures are from one of three independent stainings. Scale bar, 10 μm in all panels.
Figure 8.
Figure 8.
Enhanced radiosensitivity in Cdk2−/− cells. (A) Line graph displaying the proliferation rate of Cdk2+/+ and Cdk2−/− nonirradiated and irradiated (5 and 10 Gy) MEFs. (B) Kaplan-Meier survival curve of Cdk2+/+ (n = 20), Cdk2−/− (n = 16), and p53−/− (n = 7) mice in response to 11-Gy whole body irradiation. p53−/− mice were used as a control. (C) Representative photographs of comet migration tails showing high, low, and no damage. Bar graph presenting the number of cells with different level of DNA damage as measured by migration of Comet tails in Cdk2+/+ (red) and Cdk2−/− (blue) cells 2 h after 5-Gy irradiation (D), 18 h after 5-Gy irradiation (E), 2 h after 10-Gy irradiation (F), and 18 h after 10-Gy irradiation (G). For each time point a minimum of 100 nuclei were scored from each sample. Each sample was determined in triplicates, and the averages and SDs were calculated from three independent experiments with three independent batches of MEF cells.
Figure 9.
Figure 9.
Cdk2−/− cells have impaired DNA repair activity. (A and B) Immunofluorescence staining of γ-H2AX in 5-Gy irradiated and serum-stimulated Cdk2+/+ and Cdk2−/− MEFs at the indicated time points. γ-H2AX foci were detected by rabbit anti-γ-H2AX antibodies followed by AlexaFluor568 goat anti-rabbit antibodies in Cdk2+/+ (red; A1–A5) and in Cdk2−/− (red; B1–B5) cells. The nuclei were counter-stained with DAPI and the merged AlexaFluor568 and DAPI pictures were presented (scale bar, 10 μm). Bar graphs (red bars: Cdk2+/+, blue bars: Cdk2−/−) displaying the total number of cells on the Y axis and the number of γ-H2AX foci (C) or phospho-(Ser/Thr) ATM/ATR substrate foci (D) per cell on the X axis at the indicated time point. Number of foci was counted from (single plane images) a minimum of 200 cells per genotype at each time point.

Similar articles

Cited by

References

    1. Adams P. D., Sellers W. R., Sharma S. K., Wu A. D., Nalin C. M., Kaelin W. G. Identification of a cyclin-Cdk2 recognition motif present in substrates and p21-like cyclin-dependent kinase inhibitors. Mol. Cell. Biol. 1996;16:6623–6633. - PMC - PubMed
    1. Ahmed S. A., Gogal R. M., Jr, Walsh J. E. A new rapid and simple non-radioactive assay to monitor and determine the proliferation of lymphocytes: an alternative to [3H]-thymidine incorporation assay. J. Immunol. Methods. 1994;170:211–224. - PubMed
    1. Albrecht J. H., Meyer A. H., Hu M. Y. Regulation of cyclin-dependent kinase inhibitor p21WAF1/Cip1/Sdi1 gene expression in hepatic regeneration. Hepatology. 1997;25:557–563. - PubMed
    1. Aleem E., Kiyokawa H., Kaldis P. Cdc2-cyclin E complexes regulate the G1/S phase transition. Nat. Cell Biol. 2005;7:831–836. - PubMed
    1. Bailly E., Dorée M., Nurse P., Bornens M. p34Cdc2 is located in both nucleus and cytoplasm; part is centrosomally associated at G2/M and enters vesicles at anaphase. EMBO J. 1989;8:3985–3995. - PMC - PubMed

Publication types

MeSH terms

Substances