. 2008 Jan;19(1):150-8.
doi: 10.1091/mbc.e07-05-0515. Epub 2007 Oct 17.

The function of mitochondria in presynaptic development at the neuromuscular junction

Affiliations

The function of mitochondria in presynaptic development at the neuromuscular junction

Chi Wai Lee et al. Mol Biol Cell. 2008 Jan.

Abstract

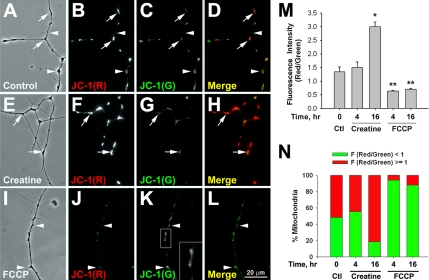
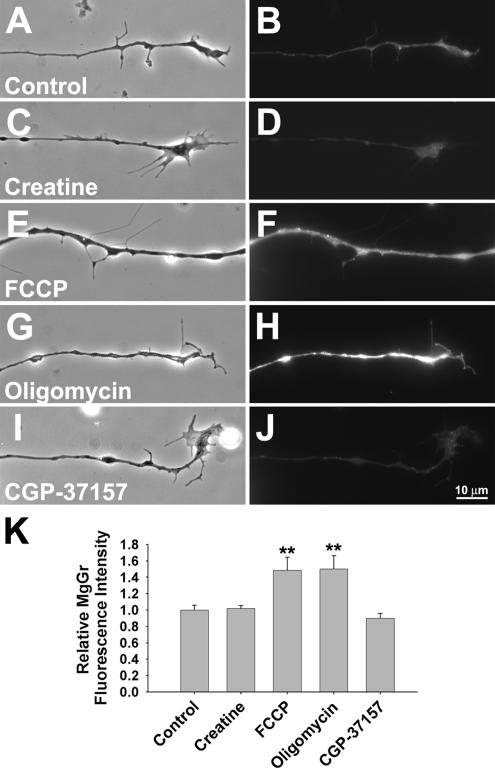
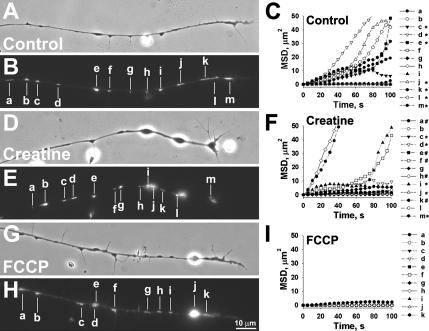
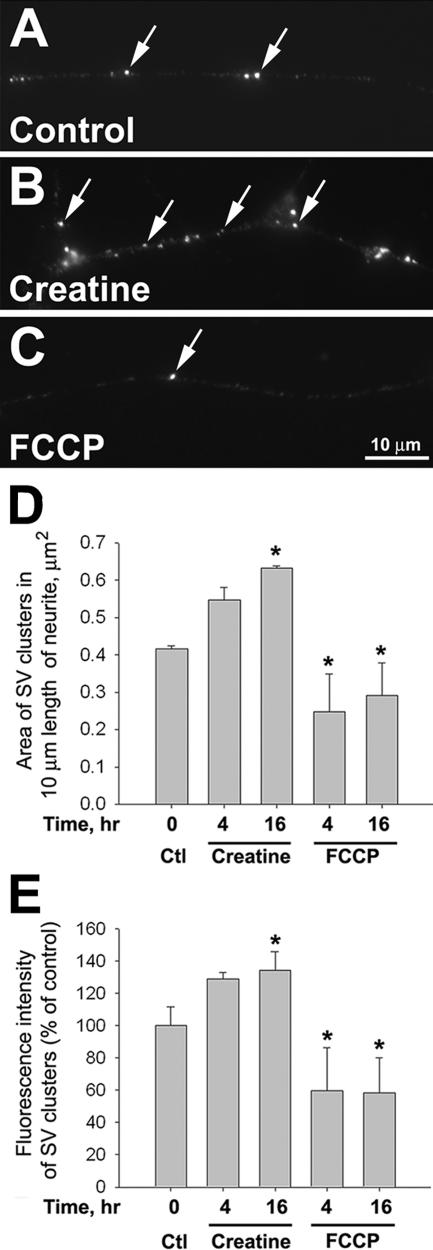
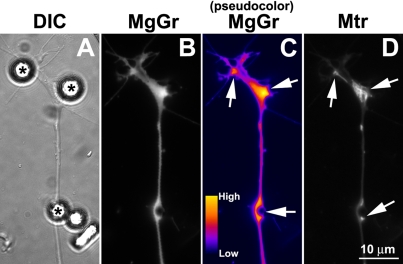
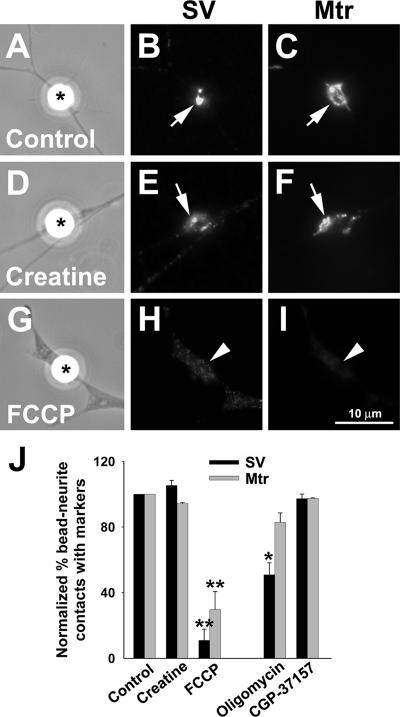
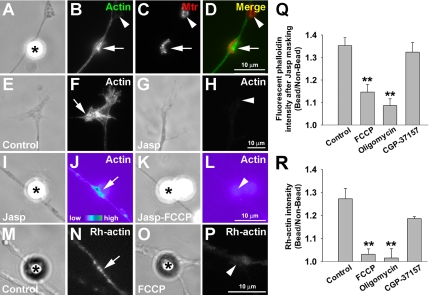
Mitochondria with high membrane potential (DeltaPsi(m)) are enriched in the presynaptic nerve terminal at vertebrate neuromuscular junctions, but the exact function of these localized synaptic mitochondria remains unclear. Here, we investigated the correlation between mitochondrial DeltaPsi(m) and the development of synaptic specializations. Using mitochondrial DeltaPsi(m)-sensitive probe JC-1, we found that DeltaPsi(m) in Xenopus spinal neurons could be reversibly elevated by creatine and suppressed by FCCP. Along naïve neurites, preexisting synaptic vesicle (SV) clusters were positively correlated with mitochondrial DeltaPsi(m), suggesting a potential regulatory role of mitochondrial activity in synaptogenesis. Indicating a specific role of mitochondrial activity in presynaptic development, mitochondrial ATP synthase inhibitor oligomycin, but not mitochondrial Na(+)/Ca(2+) exchanger inhibitor CGP-37157, inhibited the clustering of SVs induced by growth factor-coated beads. Local F-actin assembly induced along spinal neurites by beads was suppressed by FCCP or oligomycin. Our results suggest that a key role of presynaptic mitochondria is to provide ATP for the assembly of actin cytoskeleton involved in the assembly of the presynaptic specialization including the clustering of SVs and mitochondria themselves.


Figures

Figure 1.
Figure 1.
Manipulation of mitochondrial ΔΨm by creatine and FCCP. (A–D) Cultured Xenopus spinal neurons were stained with 0.25 μg/ml JC-1 for 10 min. Live imaging of JC-1 signal showed heterogeneous populations of mitochondria with high (arrows) and low (arrowheads) ΔΨm in untreated neurons. (E–H) Treatment of 100 μM creatine for 16 h greatly enhanced the average mitochondrial ΔΨm and the population of mitochondria with higher ΔΨm (arrows). (I–L) Most of the mitochondria exhibited lower ΔΨm (arrowheads) after 0.5 μM FCCP treatment for 4 h. In addition, the signal of JC-1 monomers was less distinct and spread over the neurite (K, inset). (M) Quantification of the ratiometric analyses of JC-1 red and green fluorescence intensity in response to creatine and FCCP. Data are means ± SEM from three independent experiments; n > 80 morphologically distinct mitochondria. * p < 0.05, ** p < 0.01, t test. (N) Quantification of the populations of mitochondria with high and low ΔΨm in the cultured neurons. Mitochondria were classified as high ΔΨm, F (red/green) ≥ 1, when the fluorescence intensity at 590 nm (red) is higher than or equal to that at 525 nm (green). Mitochondria with high ΔΨm were more abundant in creatine-treated neurons, but less in FCCP-treated neurons. Data are based on 80 morphologically distinct mitochondria from three independent experiments.
Figure 2.
Figure 2.
Influence of different mitochondrial function manipulators on intracellular ATP level. (A–J) The relative ATP content in neurons was examined by a fluorescent probe, magnesium green (MgGr), whose fluorescence intensity is inversely correlated to the intracellular ATP level. Cultured neurons were labeled with 10 μM MgGr-AM ester for 30 min, followed by fluorescence live imaging. (A, C, E, G, and I) Phase-contrast images. By comparison with the untreated neurons (B), FCCP (F), and oligomycin (H) elevated the intensity of overall MgGr fluorescence in treated neurons. In contrast, creatine (D) and CGP-37157 (J) had no significant effect on intracellular ATP level. (K) Quantification of relative MgGr fluorescence intensity along neurites (±SD from two independent experiments, n > 20 neurites. **p < 0.01, t test).
Figure 3.
Figure 3.
Regulation of mitochondrial movement by their ΔΨm. Cultured neurons were treated with creatine (D–F) and FCCP (G–I) for 16 and 4 h, respectively. Mitochondria were labeled with MitoTracker (B, E, and H). (A, D, and G) The corresponding phase-contrast images. The mobility of mitochondria along the naïve neurites in the presence of different mitochondrial ΔΨm manipulators was followed by time-lapse recording for 100 s. The corresponding mitochondria, marked with a–m (A–F) or a–k (G–I), were analyzed by MSD in which the diffusion coefficients of the mitochondria were reflected by their slope. The directionality of each mitochondrion's movement is indicated along its MSD plot. (C, F, and I), *, anterograde; #, retrograde; and unmarked for stationary. Time-lapse video clips with a 5-s interval between adjacent frames are available in Supplementary Videos 1–3.
Figure 4.
Figure 4.
Mitochondrial ΔΨm-dependent clustering of SVs along the naïve neurites. (A–C) The cultured neurons were treated with creatine or FCCP for 4 or 16 h. They were then fixed and labeled with a SV marker, synapsin-1. More SV clusters were found along neurite in cultures treated with 100 μM creatine for 16 h (arrows in B) than in untreated cultures (arrows in A). In 4- and 16-h time points, fewer SV clusters were detected in 0.5 μM FCCP-treated cultures (arrow in C). (D and E) Area and intensity of SV clusters were measured after background subtraction by ImageJ software. Quantification of the area of SV clusters per unit length of neurite (D) and normalized fluorescence intensity of SV clusters (E). Means from three independent experiments are shown; n >30 neurites. *p < 0.05, t test.
Figure 5.
Figure 5.
Local ATP depletion at bFGF bead-induced presynaptic specializations. Cultured spinal neurons were labeled sequentially with MitoTracker and MgGr and then were stimulated with bFGF-coated beads for 30 min. To clearly show the intensity difference, original fluorescence image of MgGr staining (B) was converted to pseudocolor image by ImageJ software (C). bFGF beads (asterisks in A) caused a dramatic decrease in ATP level at bead contact sites where presynaptic specializations developed, as evidenced by an increase in MgGr intensity (arrows in C). These sites were also enriched in mitochondria (arrows in D).
Figure 6.
Figure 6.
Mitochondrial ΔΨm and presynaptic differentiation induced by beads. (A–I) MitoTracker-loaded neurons were treated with either 100 μM creatine or 0.5 μM FCCP at 1 h before bead stimulation and being kept in the medium throughout the experiment. After bead stimulation for 4 h, the neurons were fixed and labeled with synapsin-1 antibody. bFGF beads induced the clustering of SVs and mitochondria in both control (arrows in A–C) and creatine-treated cultures (arrows in D–F). However, in FCCP-treated cultures, neither SVs nor mitochondria were clustered at bead-neurite contacts (arrowheads in G–I). (J) Quantification of the presynaptic differentiation. Bead-neurite contacts were scored positive for mitochondrial and SV clustering if the mean fluorescence intensity of the corresponding marker was at least twofold over the noncontact region. Data are means ± SEM from three independent experiments; n > 150 bead-neurite contacts. * p < 0.05, ** p < 0.01, t test.
Figure 7.
Figure 7.
Mitochondrial ΔΨm-dependent assembly of F-actin by beads. (A–D) MitoTracker-labeled neurons were induced by bFGF beads for 2 h and then fixed for F-actin staining. The bead-induced mitochondrial cluster (arrow in C) was enriched with F-actin cytoskeleton as visualized by FITC-phalloidin (arrow in B). On the other hand, mitochondrial clusters away from beads were not associated with F-actin concentration (arrowheads in B–D). (E–H) To examine the role of newly polymerized F-actin, cultured neurons were incubated with 1 μM jasplakinolide (Jasp) for 3 min to mask the pre-existing F-actin before bead addition. In control neurons, F-actin, labeled by phalloidin, was highly enriched at the peripheral domain of the growth cone (arrow in F), but this was not seen in neurons pretreated with Jasp (arrowhead in H). (I–L) After masking the pre-existing F-actin with Jasp, the treated neurons were stimulated by bFGF beads for 2 h. Assembly of F-actin was locally induced at the bead-neurite contact (asterisk in I), which was prominently displayed in pseudocolor image (arrow in J). FCCP suppressed the local F-actin assembly induced by bead (arrowhead in L). (M–P) The effect of mitochondrial manipulators on bead-induced actin polymerization was also examined by the incorporation of rhodamine-conjugated G-actin (Rh-actin) into the barbed ends of actin filaments. Cultured neurons were stimulated by beads for 2 h and then incubated with 0.45 μM Rh-actin in saponin-containing buffer for 45 s. Rh-actin signal at the bead contact sites was significantly reduced in FCCP-treated neurons (arrowhead in P) when compared with the control (arrow in N). (Q and R) Quantifications of relative fluorescence intensity of rhodamine-conjugated phalloidin (after Jasp treatment; Q) and Rh-actin (R) at bead-contacts versus bead-free areas. Data are means ± SEM from three independent experiments; n > 30 bead-neurite contacts. **p < 0.01, t test.

References

    1. Alnaes E., Rahamimoff R. On the role of mitochondria in transmitter release from motor nerve terminals. J. Physiol. 1975;248:285–306. - PMC - PubMed
    1. Ankarcrona M., Dypbukt J. M., Bonfoco E., Zhivotovsky B., Orrenius S., Lipton S. A., Nicotera P. Glutamate-induced neuronal death: a succession of necrosis or apoptosis depending on mitochondrial function. Neuron. 1995;15:961–973. - PubMed
    1. Baron K. T., Thayer S. A. CGP37157 modulates mitochondrial Ca2+ homeostasis in cultured rat dorsal root ganglion neurons. Eur. J. Pharmacol. 1997;340:295–300. - PubMed
    1. Benfenati F., Valtorta F., Greengard P. Computer modeling of synapsin I binding to synaptic vesicles and F-actin: implications for regulation of neurotransmitter release. Proc. Natl. Acad. Sci. USA. 1991;88:575–579. - PMC - PubMed
    1. Bernstein B. W., Bamburg J. R. Actin-ATP hydrolysis is a major energy drain for neurons. J. Neurosci. 2003;23:1–6. - PMC - PubMed

Publication types

MeSH terms

LinkOut - more resources