

Interferon alpha induces nucleus-independent apoptosis by activating extracellular signal-regulated kinase 1/2 and c-Jun NH2-terminal kinase downstream of phosphatidylinositol 3-kinase and mammalian target of rapamycin
- PMID: 17942603
- PMCID: PMC2174198
- DOI: 10.1091/mbc.e07-04-0358
Interferon alpha induces nucleus-independent apoptosis by activating extracellular signal-regulated kinase 1/2 and c-Jun NH2-terminal kinase downstream of phosphatidylinositol 3-kinase and mammalian target of rapamycin
Abstract
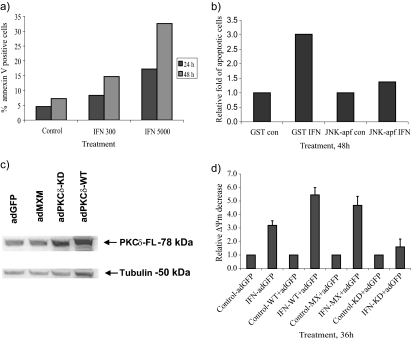
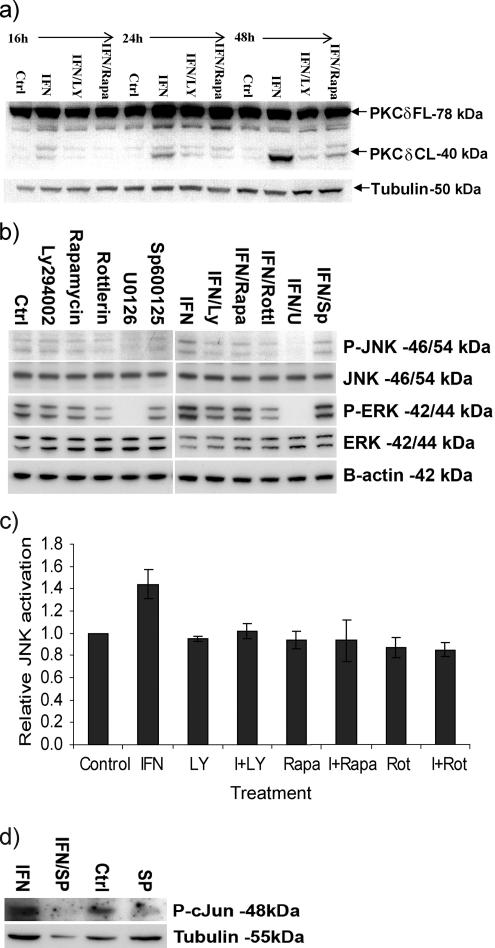
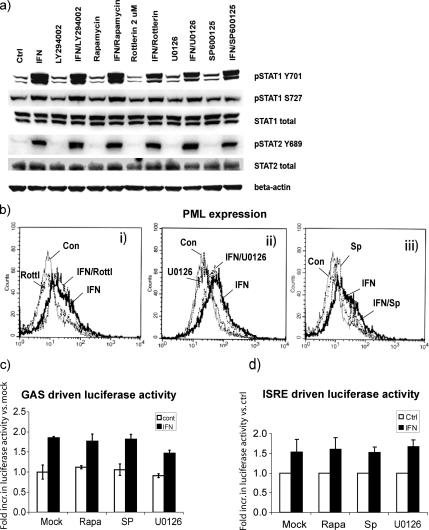
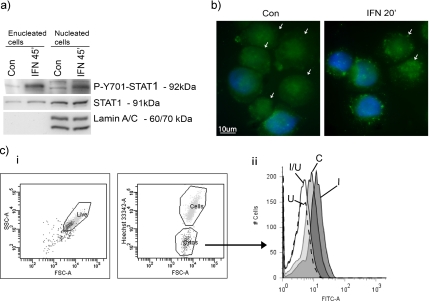
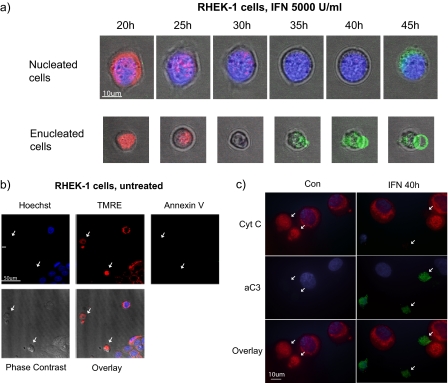
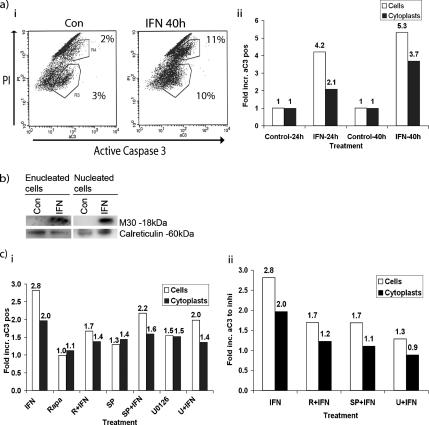
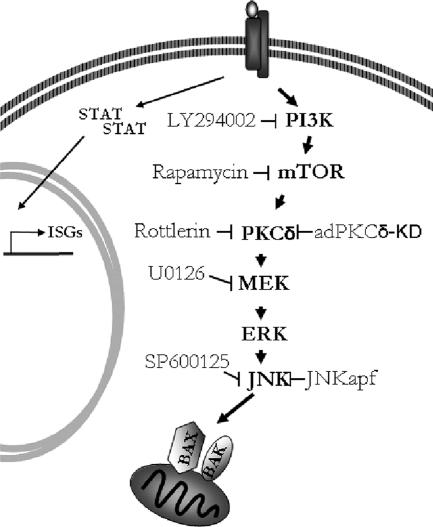
Interferon (IFN)alpha induces apoptosis via Bak and Bax and the mitochondrial pathway. Here, we investigated the role of known IFNalpha-induced signaling cascades upstream of Bak activation. By pharmacological and genetic inhibition of the kinases protein kinase C (PKC)delta, extracellular signal-regulated kinase (ERK), and c-Jun NH(2)-terminal kinase (JNK) in U266-1984 and RHEK-1 cells, we could demonstrate that all three enzymes are critical for the apoptosis-associated mitochondrial events and apoptotic cell death induced by IFNalpha, at a step downstream of phosphatidylinositol 3-kinase (PI3K) and mammalian target of rapamycin (mTOR). Furthermore, the activation of JNK was found to occur in a PKCdelta/ERK-dependent manner. Inhibition of these kinases did not affect the canonical IFNalpha-stimulated Janus tyrosine kinase-signal transducer and activator of transcription signaling or expression of IFN-responsive genes. Therefore, enucleated cells (cytoplasts) were examined for IFNalpha-induced apoptosis, to test directly whether this process depends on gene transcription. Cytoplasts were found to undergo apoptosis after IFNalpha treatment, as analyzed by several apoptosis markers by using flow cytometry, live cell imaging, and biochemical analysis of flow-sorted cytoplasts. Furthermore, inhibition of mTOR, ERK, and JNK blocked IFNalpha-induced apoptosis in cytoplasts. In conclusion, IFNalpha-induced apoptosis requires activation of ERK1/2, PKCdelta, and JNK downstream of PI3K and mTOR, and it can occur in a nucleus-independent manner, thus demonstrating for the first time that IFNalpha induces apoptosis in the absence of de novo transcription.
Figures

Similar articles
-
Interferon alpha-induced apoptosis in tumor cells is mediated through the phosphoinositide 3-kinase/mammalian target of rapamycin signaling pathway.J Biol Chem. 2004 Jun 4;279(23):24152-62. doi: 10.1074/jbc.M312219200. Epub 2004 Mar 31. J Biol Chem. 2004. PMID: 15056668
-
Farnesyltransferase inhibitors interact synergistically with the Chk1 inhibitor UCN-01 to induce apoptosis in human leukemia cells through interruption of both Akt and MEK/ERK pathways and activation of SEK1/JNK.Blood. 2005 Feb 15;105(4):1706-16. doi: 10.1182/blood-2004-07-2767. Epub 2004 Oct 19. Blood. 2005. PMID: 15494423
-
Docetaxel-induced apoptosis of human melanoma is mediated by activation of c-Jun NH2-terminal kinase and inhibited by the mitogen-activated protein kinase extracellular signal-regulated kinase 1/2 pathway.Clin Cancer Res. 2007 Feb 15;13(4):1308-14. doi: 10.1158/1078-0432.CCR-06-2216. Clin Cancer Res. 2007. PMID: 17317842
-
Chromatin-tethered MAPKs.Curr Opin Cell Biol. 2013 Apr;25(2):272-7. doi: 10.1016/j.ceb.2013.01.002. Epub 2013 Feb 20. Curr Opin Cell Biol. 2013. PMID: 23434067 Free PMC article. Review.
-
A death-promoting role for extracellular signal-regulated kinase.J Pharmacol Exp Ther. 2006 Dec;319(3):991-7. doi: 10.1124/jpet.106.107367. Epub 2006 Jun 26. J Pharmacol Exp Ther. 2006. PMID: 16801453 Review.
Cited by
-
[Preclinical studies on the influence of the tyrosine kinase inhibitor AEE788 on malignant properties of renal cell carcinoma cells].Urologe A. 2008 Sep;47(9):1175-81. doi: 10.1007/s00120-008-1831-1. Urologe A. 2008. PMID: 18688594 German.
-
Tamoxifen-Induced Apoptosis of MCF-7 Cells via GPR30/PI3K/MAPKs Interactions: Verification by ODE Modeling and RNA Sequencing.Front Physiol. 2018 Jul 11;9:907. doi: 10.3389/fphys.2018.00907. eCollection 2018. Front Physiol. 2018. PMID: 30050469 Free PMC article.
-
Interferons as inducers of apoptosis in malignant cells.J Interferon Cytokine Res. 2013 Apr;33(4):162-70. doi: 10.1089/jir.2012.0110. J Interferon Cytokine Res. 2013. PMID: 23570382 Free PMC article. Review.
-
Contribution of endoplasmic reticulum stress, MAPK and PI3K/Akt pathways to the apoptotic death induced by a penicillin derivative in melanoma cells.Apoptosis. 2022 Feb;27(1-2):34-48. doi: 10.1007/s10495-021-01697-7. Epub 2021 Nov 12. Apoptosis. 2022. PMID: 34773171
-
Novaferon, a novel recombinant protein produced by DNA-shuffling of IFN-α, shows antitumor effect in vitro and in vivo.Cancer Cell Int. 2014 Jan 27;14(1):8. doi: 10.1186/1475-2867-14-8. Cancer Cell Int. 2014. PMID: 24467885 Free PMC article.
References
-
- Baek S. H., Lee U. Y., Park E. M., Han M. Y., Lee Y. S., Park Y. M. Role of protein kinase Cdelta in transmitting hypoxia signal to HSF and HIF-1. J. Cell. Physiol. 2001;188:223–235. - PubMed
-
- Burfoot M. S., Rogers N. C., Watling D., Smith J. M., Pons S., Paonessaw G., Pellegrini S., White M. F., Kerr I. M. Janus kinase-dependent activation of insulin receptor substrate 1 in response to interleukin-4, oncostatin M, and the interferons. J. Biol. Chem. 1997;272:24183–24190. - PubMed
-
- Caraglia M., et al. Interferon-alpha induces apoptosis in human KB cells through a stress-dependent mitogen activated protein kinase pathway that is antagonized by epidermal growth factor. Cell Death Differ. 1999;6:773–780. - PubMed
-
- Carpenter L., Cordery D., Biden T. J. Protein kinase Cdelta activation by interleukin-1beta stabilizes inducible nitric-oxide synthase mRNA in pancreatic beta-cells. J. Biol. Chem. 2001;276:5368–5374. - PubMed
-
- Darnell J. E., Jr STATs and gene regulation. Science. 1997;277:1630–1635. - PubMed
Publication types
MeSH terms
Substances
LinkOut - more resources
Full Text Sources
Research Materials
Miscellaneous
