

Regulation of fibroblast growth factor-2 expression in pulmonary arterial smooth muscle cells involves increased reactive oxygen species generation
- PMID: 17942638
- PMCID: PMC3970933
- DOI: 10.1152/ajpcell.00216.2007
Regulation of fibroblast growth factor-2 expression in pulmonary arterial smooth muscle cells involves increased reactive oxygen species generation
Abstract
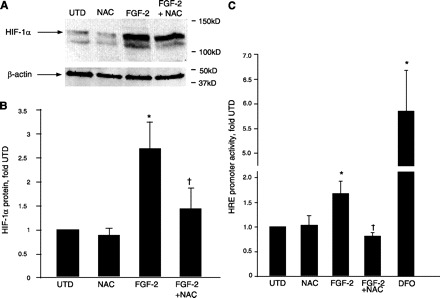
We have previously demonstrated increased fibroblast growth factor-2 (FGF-2) expression in a lamb model of increased pulmonary blood flow secondary to congenital heart disease, which may contribute to the associated increases in pulmonary arterial muscularization. However, the mechanisms underlying these increases in FGF-2 expression remain to be identified. Initially, we found that exogenous FGF-2 increased endogenous FGF-2 promoter activity and protein levels in ovine pulmonary arterial smooth muscle cells (PASMC). Furthermore, we found that these increases in FGF-2 expression were mediated by increases in superoxide levels via NADPH oxidase activation. In addition, FGF-2-mediated increases in FGF-2 expression and PASMC proliferation were attenuated by inhibition of phosphatidylinositol 3-kinase, Akt, and NADPH oxidase. Increases in FGF-2 expression could be stimulated by other factors known to increase reactive oxygen species (ROS) signaling in PASMC (endothelin-1 and transforming growth factor-beta1), whereas antioxidants attenuated these increases. Deletion constructs localized the growth factor- and ROS-sensitive region within the proximal 103 bp of the FGF-2 promoter, and sequence analysis identified a putative hypoxia response element (HRE), a DNA binding site for the ROS-sensitive transcription factor hypoxia-inducible factor-1alpha (HIF-1alpha). Stabilization of HIF-1alpha increased FGF-2 promoter activity, whereas mutation of the putative HRE attenuated FGF-2-induced FGF-2 promoter activity. Furthermore, FGF-2 increased HIF-1alpha protein levels and consensus HRE promoter activity in PASMC via antioxidant-sensitive mechanisms. Thus we conclude that FGF-2 can stimulate its own expression in PASMC via NADPH oxidase-mediated activation of ROS-sensitive transcription factors, including HIF-1alpha. This positive feedback mechanism may contribute to pulmonary vascular remodeling associated with increased pulmonary blood flow.
Figures


Similar articles
-
NOX4 mediates hypoxia-induced proliferation of human pulmonary artery smooth muscle cells: the role of autocrine production of transforming growth factor-{beta}1 and insulin-like growth factor binding protein-3.Am J Physiol Lung Cell Mol Physiol. 2009 Mar;296(3):L489-99. doi: 10.1152/ajplung.90488.2008. Epub 2008 Nov 26. Am J Physiol Lung Cell Mol Physiol. 2009. PMID: 19036873 Free PMC article.
-
Thioredoxin-1 mediates hypoxia-induced pulmonary artery smooth muscle cell proliferation.Am J Physiol Lung Cell Mol Physiol. 2013 Sep;305(5):L389-95. doi: 10.1152/ajplung.00432.2012. Epub 2013 Jun 28. Am J Physiol Lung Cell Mol Physiol. 2013. PMID: 23812635 Free PMC article.
-
Antioxidant mechanism of Rutin on hypoxia-induced pulmonary arterial cell proliferation.Molecules. 2014 Nov 18;19(11):19036-49. doi: 10.3390/molecules191119036. Molecules. 2014. PMID: 25412048 Free PMC article.
-
Interactions between calcium and reactive oxygen species in pulmonary arterial smooth muscle responses to hypoxia.Respir Physiol Neurobiol. 2010 Dec 31;174(3):221-9. doi: 10.1016/j.resp.2010.08.014. Epub 2010 Aug 27. Respir Physiol Neurobiol. 2010. PMID: 20801238 Free PMC article. Review.
-
Human Vascular Smooth Muscle Function and Oxidative Stress Induced by NADPH Oxidase with the Clinical Implications.Cells. 2021 Jul 31;10(8):1947. doi: 10.3390/cells10081947. Cells. 2021. PMID: 34440716 Free PMC article. Review.
Cited by
-
DNA Damage and Pulmonary Hypertension.Int J Mol Sci. 2016 Jun 22;17(6):990. doi: 10.3390/ijms17060990. Int J Mol Sci. 2016. PMID: 27338373 Free PMC article. Review.
-
Glucose, insulin, and oxygen interplay in placental hypervascularisation in diabetes mellitus.Biomed Res Int. 2014;2014:145846. doi: 10.1155/2014/145846. Epub 2014 Sep 2. Biomed Res Int. 2014. PMID: 25258707 Free PMC article. Review.
-
Stem Cells in Skin Wound Healing: Are We There Yet?Adv Wound Care (New Rochelle). 2016 Apr 1;5(4):164-175. doi: 10.1089/wound.2014.0607. Adv Wound Care (New Rochelle). 2016. PMID: 27076994 Free PMC article. Review.
-
Organization of self-advantageous niche by neural stem/progenitor cells during development via autocrine VEGF-A under hypoxia.Inflamm Regen. 2023 Feb 1;43(1):8. doi: 10.1186/s41232-022-00254-2. Inflamm Regen. 2023. PMID: 36726165 Free PMC article.
-
Isolation of pulmonary artery smooth muscle cells from neonatal mice.J Vis Exp. 2013 Oct 19;(80):e50889. doi: 10.3791/50889. J Vis Exp. 2013. PMID: 24193306 Free PMC article.
References
-
- Bentisty JI, McLaughlin VV, Landzberg MJ, Rich JD, Newburger JW, Rich S, Folkman J. Elevated fibroblast growth factor levels in patients with pulmonary arterial hypertension. Chest 126: 1255–1261, 2004 - PubMed
-
- Black SM, Bekker JM, Johengen MJ, Parry AJ, Soifer SJ, Fineman JR. Altered regulation of the ET-1 cascade in lambs with increased pulmonary blood flow and pulmonary hypertension. Pediatr Res 47: 97–106, 2000 - PubMed
-
- Black SM, Fineman JR, Steinhorn RH, Bristow J, Soifer SJ. Increased endothelial NOS in lambs with increased pulmonary blood flow and pulmonary hypertension. Am J Physiol Heart Circ Physiol 275: H1643–H1651, 1998 - PubMed
-
- Brogi E, Wu T, Namiki A, Isner JM. Indirect angiogenic cytokines upregulate VEGF and bFGF gene expression in vascular smooth muscle cells, whereas hypoxia upregulates VEGF expression only. Circulation 90: 649–652, 1994 - PubMed
Publication types
MeSH terms
Substances
Grants and funding
LinkOut - more resources
Full Text Sources