. 2007 Oct 23;104(43):17069-74.
doi: 10.1073/pnas.0708148104. Epub 2007 Oct 17.

Multiple circulating proangiogenic factors induced by sunitinib malate are tumor-independent and correlate with antitumor efficacy

Affiliations

Multiple circulating proangiogenic factors induced by sunitinib malate are tumor-independent and correlate with antitumor efficacy

John M L Ebos et al. Proc Natl Acad Sci U S A. .

Abstract

Cancer patients treated with antiangiogenic multitargeted receptor tyrosine kinase (RTK) inhibitors show increased levels of plasma VEGF and placental growth factor and decreased levels of soluble VEGF receptor-2, thus implicating these overall changes as a possible class effect of such drugs and raising the possibility of their exploitation as surrogate biomarkers for pharmacodynamic drug activity/exposure and patient benefit. A postulated mechanism for these changes is that they are tumor-dependent, resulting from drug-induced decreases in vascular function, increases in tumor hypoxia, and changes in hypoxia-regulated genes. However, here we report that an identical pattern of change is observed in normal nontumor-bearing mice treated with SU11248/sunitinib, a small-molecule inhibitor of VEGF and PDGF RTKs. The changes were dose-dependent, plateaued after 4 days of consecutive treatment, reversed after discontinuation of therapy, and correlated with antitumor activity. Altered protein expression was found in a broad variety of tissues, and dose-dependent elevations were observed of several plasma proteins previously unassociated with this class of inhibitor, including G-CSF, SDF-1alpha, SCF, and osteopontin. Our results suggest that observed sunitinib-induced molecular plasma changes, including those both directly and indirectly targeted by drug, represent a systemic tumor-independent response to therapy and may correlate with the most efficacious antitumor doses, potentially having utility for defining the optimal biologic dose range for this drug class but not as predictive markers of tumor response or clinical benefit. They may also be relevant to drug-associated toxicities, drug resistance, and observed rapid tumor (re)growth seen after cessation of therapy.


Conflict of interest statement

Conflict of interest statement: J.G.C. works at Pfizer.

Figures
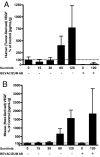
Fig. 1.
Fig. 1.
Host (mouse) and tumor (human) VEGF levels rise in tumor-bearing mice treated with sunitinib. (A) Plasma taken from SCID mice bearing s.c. human PC3 tumors overexpressing human VEGF165 were measured for human (tumor-derived) VEGF by ELISA and found to be elevated after 7 days of oral administration of sunitinib at varying doses (15, 30, 60, and 120 mg/kg, respectively). (B) The same plasma also showed elevated mouse (host-derived) VEGF levels. Bevacizumab was administered (300 μg per mouse) every 3 days alone and in combination with sunitinib and limited human VEGF detectability, confirming species specificity of the mouse ELISA (A and B). y axis represented as percent of control with original values represented as pg/ml of VEGF standardized to excised tumor weight (grams) (see SI Text). n = 3 or 4 for all groups. Symbols and bars, mean ± SD.
Fig. 2.
Fig. 2.
Sunitinib-mediated modulations of VEGF, PlGF, and sVEGFR-2 are reversible. Balb/C mice were treated with 7.5, 15, 30, 60, and 120 mg/kg sunitinib daily for two 7-day cycles separated by a break period. Blood was taken retroorbitally before treatment, 24 hours after treatment initiation, after both 7-day treatment cycles, and after the break period. Increased VEGF (A) and PlGF (B), along with decreased sVEGFR-2 (C), were seen after both cycles in 60 and 120 mg/kg groups but returned to baseline after treatment cessation. R/O = Retro-Orbital bleed, C/P = Cardiac Puncture bleed, Tx = Treatment. n = 5 for all groups. Symbols and bars, mean ± SD.
Fig. 3.
Fig. 3.
Plateaus of VEGF, PlGF, and sVEGFR-2 after sunitinib treatment. Daily retroorbital blood measurements were taken from alternating groups of Balb/C mice treated with 60-mg/kg-per-day sunitinib to determine kinetics of protein level changes. Plateaus in increased VEGF (A) and PlGF (B), along with decreased sVEGFR-2 (C), were seen after 4 days of treatment and reversed after 2 (VEGF and PlGF) and 5 days (sVEGFR-2) when treatment was stopped. n = 3 for all groups. Symbols and bars, mean ± SE.
Fig. 4.
Fig. 4.
Dose-dependent changes of multiple plasma proteins after sunitinib treatment in nontumor-bearing mice. Plasma of Balb/C mice treated with 30, 60, or 120 mg/kg sunitinib for 7 days were analyzed for (A) VEGF, (B) SDF-1α, (C) SCF, (D) sVEGFR-2, (E) G-CSF, (F) sTIE-2, (G) OPN, (H) EPO, (I) IL-6, and (J) PDGF-AB. All values are represented as percent of control. See Experimental Procedures for baseline levels for vehicle treated groups. Significant differences from control: *, 0.01<P < 0.05; **, 0.001<P < 0.01; ***, P < 0.001. n = 4 for all groups. For graphing simplicity, the x axis of E and J is shared by A–D and F–I, respectively. Symbols and bars, mean ± SD.
Fig. 5.
Fig. 5.
VEGF increase and VEGFR-2 decrease in tissue lysates after sunitinib treatment. Lysates made from homogenized tissues of Balb/C mice treated with 120 mg/kg sunitinib for 7 days and tested by ELISA. (A) Levels of VEGF significantly increased in liver, heart, spleen, kidney, and skin but not in bone marrow (BM) or lung. (B) Levels of VEGFR-2 in the same lysates show a significant decrease in expression in the liver, heart, spleen, kidney, BM, and skin. Significant differences from control: *, 0.01 < P < 0.05; **, 0.001 < P < 0.01; ***, P < 0.001. n = 4 for all groups. Values are shown as fold change compared with control and represent pg/ml of protein standardized to milligrams of total protein added to ELISA. Symbols and bars, mean ± SD.

Similar articles

Cited by

References

    1. Woude GF, Kelloff GJ, Ruddon RW, Koo HM, Sigman CC, Barrett JC, Day RW, Dicker AP, Kerbel RS, Parkinson DR, et al. Clin Cancer Res. 2004;10:3897–3907. - PubMed
    1. Kelloff GJ, Bast RC, Jr, Coffey DS, D'Amico AV, Kerbel RS, Park JW, Ruddon RW, Rustin GJ, Schilsky RL, Sigman CC, et al. Clin Cancer Res. 2004;10:3881–3884. - PubMed
    1. Eskens FA, Verweij J. Eur J Cancer. 2006;42:3127–3129. - PubMed
    1. Ebos JML, Bocci G, Man S, Thorpe PE, Hicklin DJ, Zhou D, Jia X, Kerbel RS. Mol Cancer Res. 2004;2:315–326. - PubMed
    1. Drevs J, Zirrgiebel U, Schmidt-Gersbach CI, Mross K, Medinger M, Lee L, Pinheiro J, Wood J, Thomas AL, Unger C, et al. Ann Oncol. 2005;16:558–565. - PubMed

Publication types

MeSH terms