. 2007 Oct 23;104(43):17180-5.
doi: 10.1073/pnas.0703183104. Epub 2007 Oct 17.

Optimally wired subnetwork determines neuroanatomy of Caenorhabditis elegans

Affiliations

Optimally wired subnetwork determines neuroanatomy of Caenorhabditis elegans

Alfonso Pérez-Escudero et al. Proc Natl Acad Sci U S A. .

Abstract

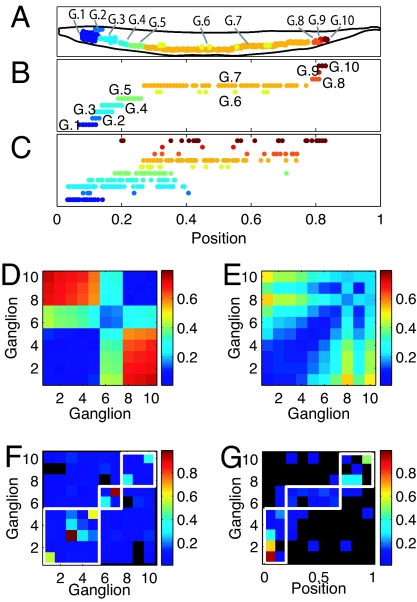
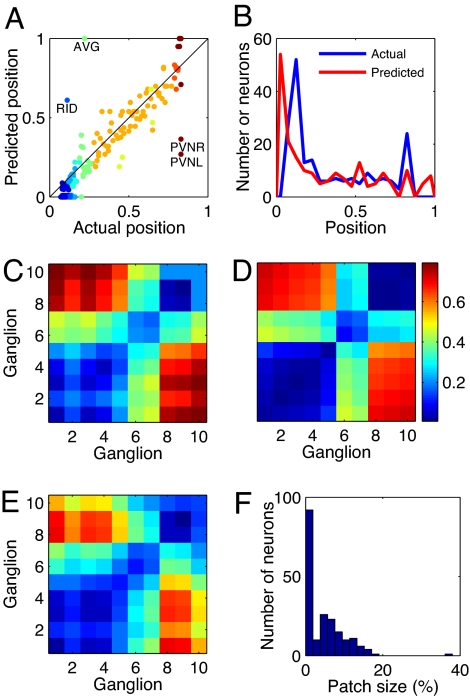
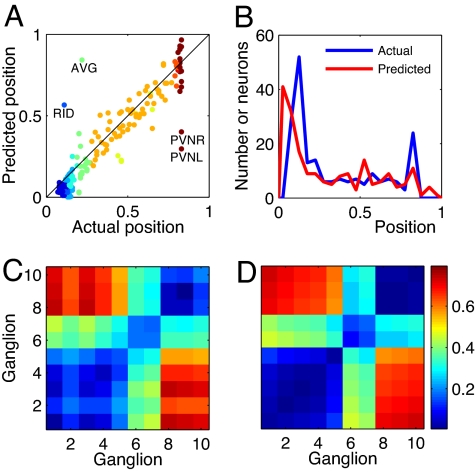
Wiring cost minimization has successfully explained many structures of nervous systems. However, in the nematode Caenorhabditis elegans, for which anatomical data are most detailed, wiring economy is thought to play only a partial role and alone has failed to account for the grouping of neurons into ganglia [Chen BL, Hall DH, Chklovskii DB (2006) Proc Natl Acad Sci USA 103:4723-4728; Kaiser M, Hilgetag CC (2006) PLoS Comput Biol 2:e95; Ahn Y-Y, Jeong H, Kim BJ (2006) Physica A 367:531-537]. Here, we test the hypothesis that optimally wired subnetworks can exist within nonoptimal networks, thus allowing wiring economy to give an improved prediction of spatial structure. We show in C. elegans that the small subnetwork of wires connecting sensory and motor neurons with sensors and muscles, comprising only 15% of connections, is close to optimal and alone predicts the main features of the spatial segregation of neurons into ganglia and encephalization. Moreover, a method to dissect networks into optimal and nonoptimal components is shown to find a large near-optimal subnetwork of 84% of neurons with a very low position error of 5.4%, and that explains clustering of neurons into ganglia and encephalization to fine detail. In general, we expect realistic networks not to be globally optimal in wire cost. We thus propose the strategy of using near-optimal subnetworks to understand neuroanatomical structure.


Conflict of interest statement

The authors declare no conflict of interest.

Figures

Fig. 1.
Fig. 1.
Optimization of the complete C. elegans network fails to predict actual clustering. (A) Soma positions in the actual nematode are organized in spatial clusters known as ganglia. (B) Soma positions in the actual nematode. Somas in different ganglia are offset for clarity. (C) Soma position obtained by minimizing the wiring cost of the complete network. Neurons in different ganglia in the actual network are offset for clarity. (D) Average distance between somas belonging to the same ganglion (diagonal elements) and different ganglia (nondiagonal elements) for the actual nematode. (E) Same as D but obtained for soma positions minimizing the total wiring cost. (F) Average number of connections per neuron between ganglia. Diagonal squares, connections between neurons belonging to the same ganglion; nondiagonal squares, connections between neurons belonging to different ganglia. White boxes enclose regions of the graph corresponding to ganglia overlapping in the one dimension considered. Elements with a value of exactly 0 are colored in black. (G) Average number of connections per neuron between ganglia and organs that lie in each of the 10 bins we divided the length of the nematode. White boxes enclose regions corresponding to connections between ganglia and organs located at the same position in the body as the ganglion. Elements with a value of exactly 0 are colored in black. C and E were obtained with α = β = 1/29.3.
Fig. 2.
Fig. 2.
Optimization of neuron-to-organ connections predicts main features of clustering. (A) Optimal positions of sensory and motor neurons, obtained by minimizing the cost of wiring them to organs, versus their actual positions. Colors distinguish different ganglia. (B) Density sensory and motor neurons along the nematode for actual and optimal positions. (C) Average distance between neurons belonging to the same ganglion (diagonal elements) or different ganglia (nondiagonal elements) for optimized sensory and motor neuron positions. (D) Same as C but for the actual nematode. (E) Same as C but optimizing the complete network. (F) Histogram of sizes of the minipatches of skin to which each neuron connects.
Fig. 3.
Fig. 3.
Connections among sensory and motor neurons improve predicted clusters. (A) Optimal positions of sensory and motor neurons, obtained by minimizing their connections to organs and among themselves, versus their actual positions. Colors distinguish different ganglia. (B) Neuron density along the nematode, for actual and optimal positions. (C) Average distance between neurons belonging to the same ganglion (diagonal elements) or different ganglia (nondiagonal elements) for optimized sensory and motor neuron positions. (D) Same as C but for the actual nematode.
Fig. 4.
Fig. 4.
Method to dissect networks into optimal and nonoptimal subnetworks. (A) Toy network configuration. Neurons 1–9 (blue) are optimal, and neuron 10 (pink) is located at random. Blue and pink links represent N and M connections each, respectively. (B) Position error for nonoptimal neuron 10 (red) and optimal neuron 7 (blue) as a function of the position of the nonoptimal neuron 10 (rest of neurons have vanishing error). Step 1 in the dissection method classifies neurons by their position error: neuron 10 is classified as the worst one when the red line is above the blue line (N > M and neuron 10 located sufficiently far from its center-of-mass position), then neuron 7, and then the rest. (C) Step 2 in the dissection method calculates the average position error ep in networks of decreasing size (from right to left) eliminating worst located neurons in the order determined in step 1 of the method. Minimum of the error located at size 9. (D) Same as C but for a network configuration with the C. elegans connectivity and with optimal and nonoptimal subnetworks (blue) and for a noisy network with neurons located at positions obtained adding to optimal positions noise following a uniform distribution of std = 8% (red). Plus signs indicate the point separating optimal and nonoptimal subnetworks. (E) Estimated size of the nonoptimal subnetwork (blue) and percentage of correctly estimated nonoptimal neurons (green). (F) Dissection method does not find a separation between optimal and nonoptimal components in noisy networks built without optimal and nonoptimal components.
Fig. 5.
Fig. 5.
Dissection of the actual C. elegans configuration into near-optimal and nonoptimal subnetworks. (A) Average position error ep in networks of decreasing size (from right to left) eliminating worst located neurons in the order determined in step 1 of the method. Separation of optimal and nonoptimal subnetworks was found automatically at the point with a plus sign corresponding to a large slope change. Insets: Predicted versus actual position for the near-optimal subnetwork and for the complete network. (B) Same as A but for the clustering error. (Insets) Clustering diagram for near-optimal subnetwork (compare with actual one in Fig. 1D) and for total network.

References

    1. Striedter GF. Principles of Brain Evolution. Sunderland, MA: Sinauer; 2004.
    1. Nusbaum MP, Blitz DM, Swensen AM, Wood D, Marder E. Trends Neurosci. 2001;24:146–154. - PubMed
    1. Konishi M. In: Elsevier's Encyclopedia of Neuroscience. Adelman G, Smith BH, editors. Amsterdam: Elsevier; 1999. pp. 1906–1908.
    1. Ramón y, Cajal S. Textura del Sistema Nervioso del Hombre y de los Vertebrados. Madrid: Nicolás Moya; 1899. Spanish. trans Pasik P, Pasik T (1999) Texture of the Nervous System of Man and the Vertebrates (Springer, New York)
    1. Mitchison G. Proc R Soc London B Biol Sci. 1991;245:151–158. - PubMed

Publication types

LinkOut - more resources