

Behavioral discrimination between sucrose and other natural sweeteners in mice: implications for the neural coding of T1R ligands
- PMID: 17942718
- PMCID: PMC6673039
- DOI: 10.1523/JNEUROSCI.1227-07.2007
Behavioral discrimination between sucrose and other natural sweeteners in mice: implications for the neural coding of T1R ligands
Abstract
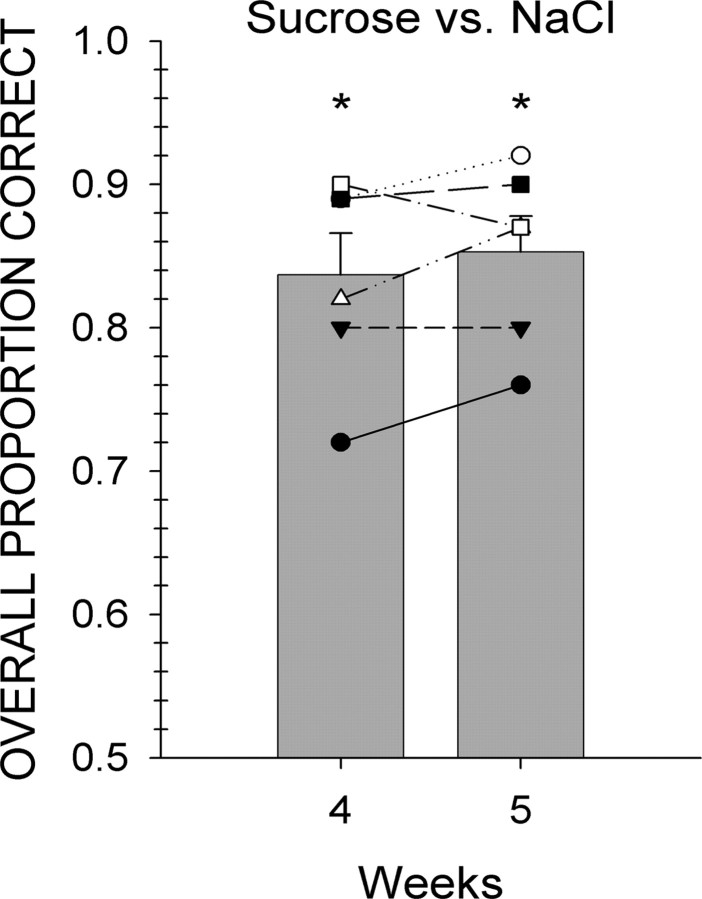
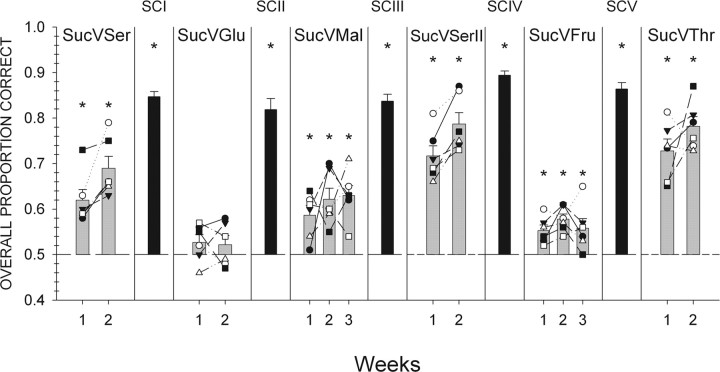
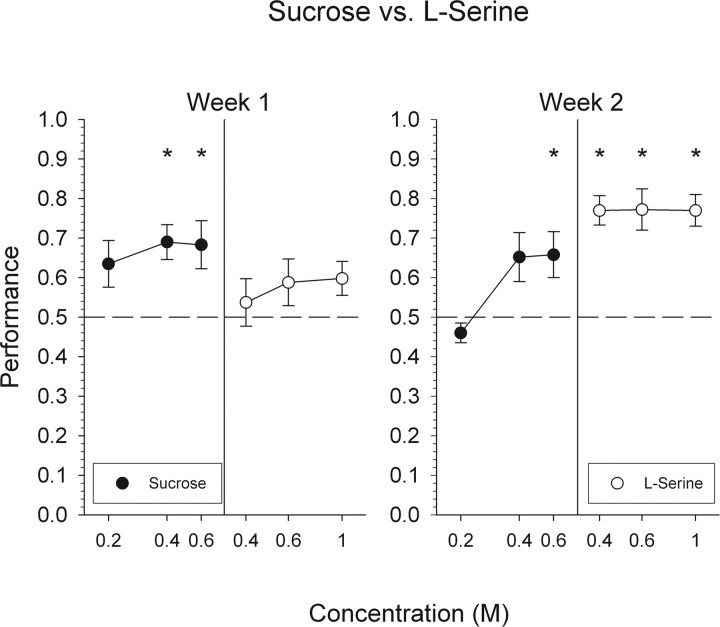
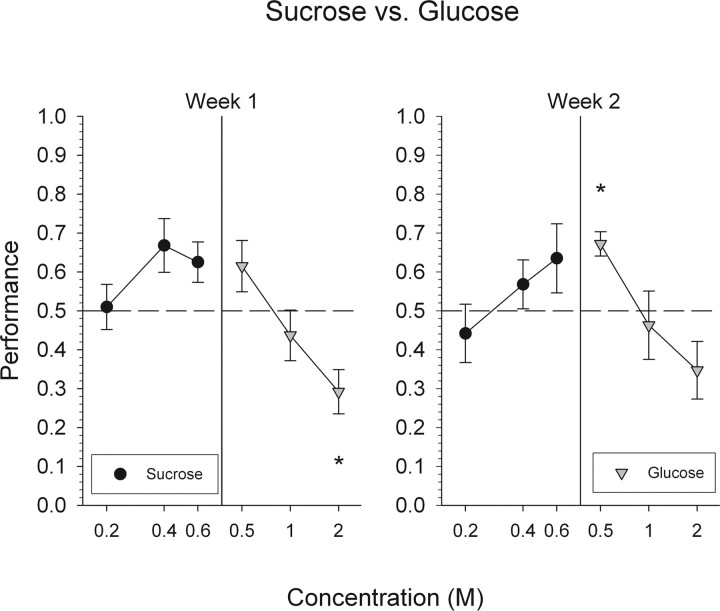
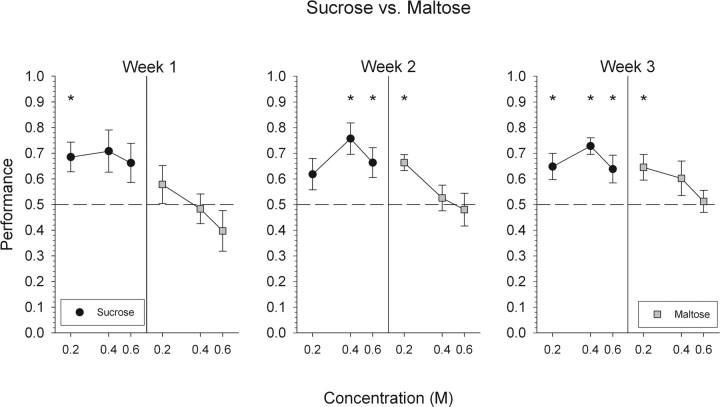
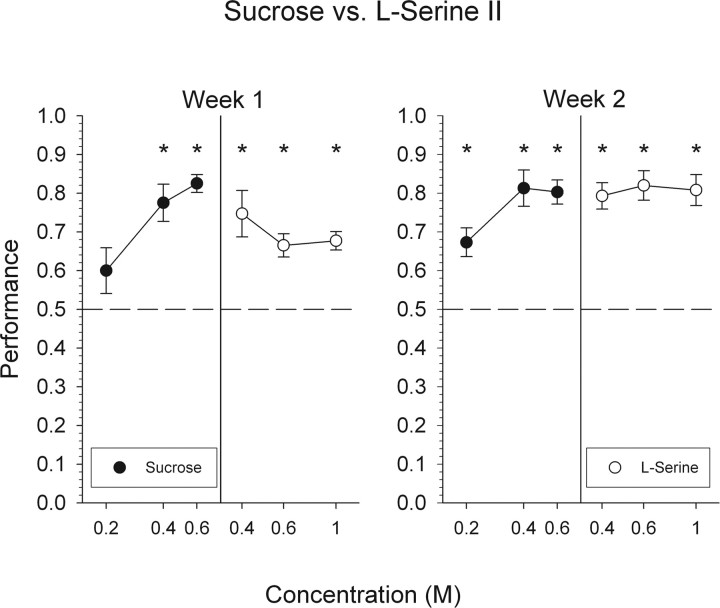
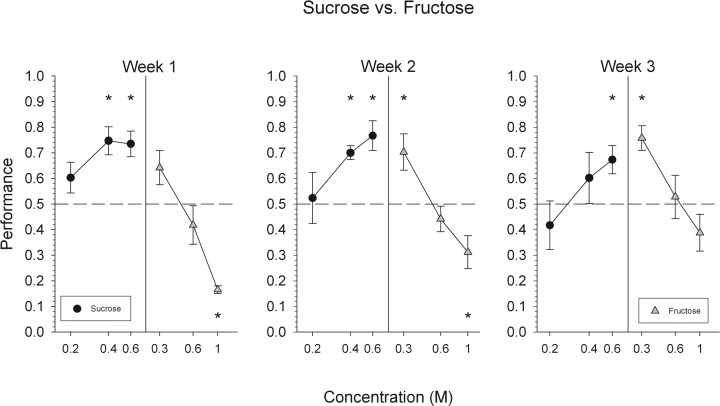
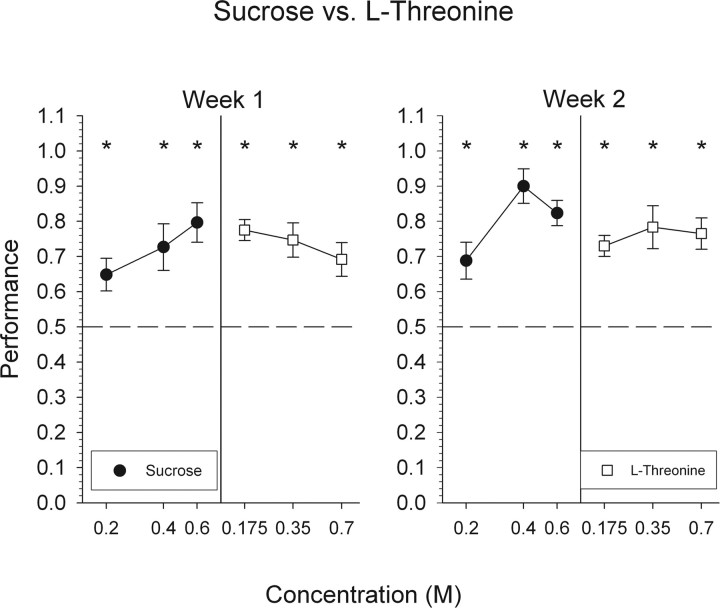
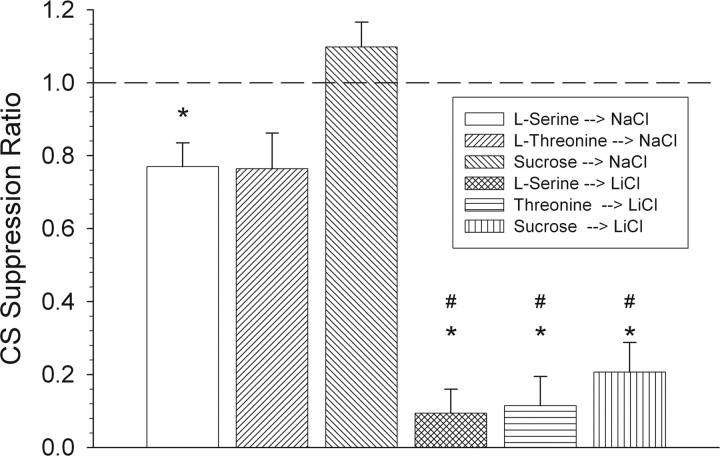
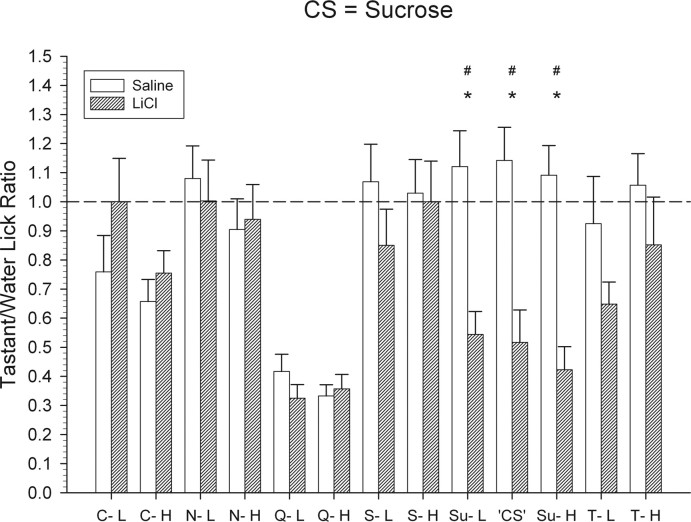
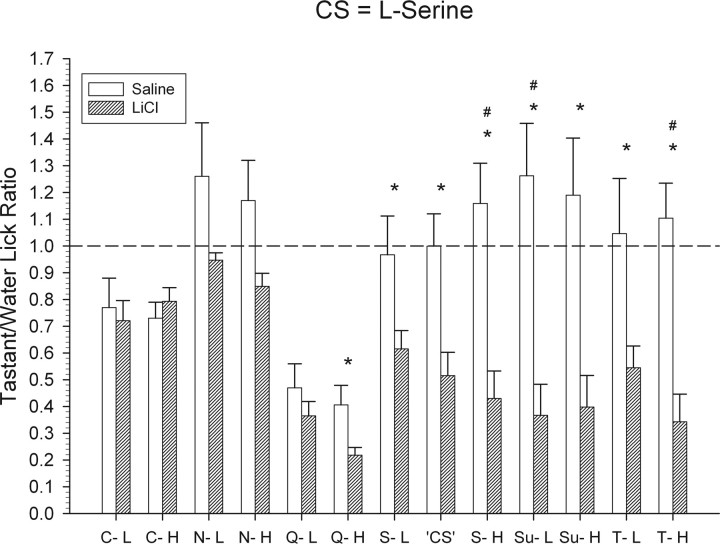
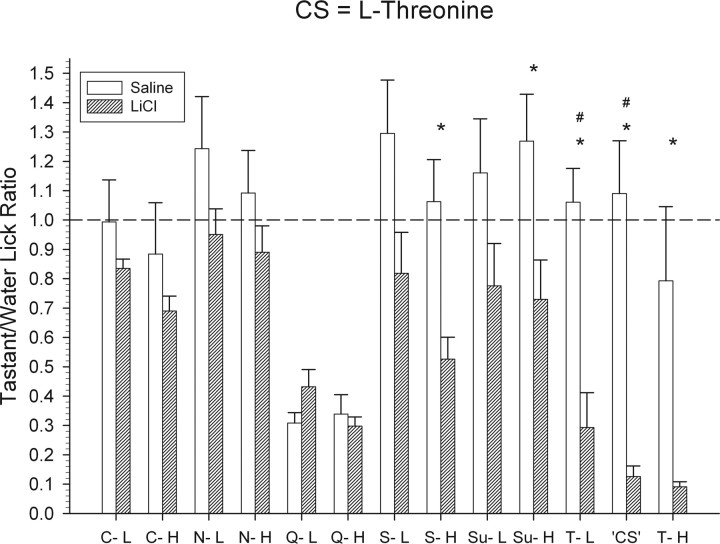
In taste bud cells, two different T1R heteromeric taste receptors mediate signal transduction of sugars (the canonical "sweet" taste receptor, T1R2 + T1R3) and L-amino acids (the T1R1 + T1R3 receptor). The T1R1 + T1R3 receptor is thought to mediate what is considered the fifth basic taste quality "umami." However, a subset of L-amino acids is "sweet tasting" to humans and appears to possess a "sucrose-like" taste quality to nonhuman mammals. This suggests, to varying degrees, that all of these compounds activate a single neural channel that leads to the perception of sweetness. The experiments detailed here were designed to test the ability of mice to distinguish between sucrose and various others sugars and L-amino acids in operant taste discrimination tasks. Mice had at least some difficulty discriminating sucrose from L-serine, L-threonine, maltose, fructose, and glucose. For example, when concentration effects are taken into consideration, mice discriminated poorly, if at all, sucrose from glucose or fructose and, to a lesser extent maltose, suggesting that sugars generate a unitary perceptual quality. However, mice were able to reliably discriminate sucrose from L-serine and L-threonine. Data gathered using a conditioned taste aversion assay also suggest that, although qualitatively similar to the taste of sucrose, L-serine and L-threonine generate distinctive percepts. In conclusion, it appears that some signals from taste receptor proteins binding with sugars and some L-amino acids converge somewhere along the gustatory neuraxis. However, the results of these experiments also imply that sweet-tasting L-amino acids may possess qualitative taste characteristics that are distinguishable from the prototypical sweetener sucrose.
Figures
Similar articles
-
Detection of maltodextrin and its discrimination from sucrose are independent of the T1R2 + T1R3 heterodimer.Am J Physiol Regul Integr Comp Physiol. 2017 Oct 1;313(4):R450-R462. doi: 10.1152/ajpregu.00049.2017. Epub 2017 Aug 2. Am J Physiol Regul Integr Comp Physiol. 2017. PMID: 28768658 Free PMC article.
-
Electrophysiological responses to sugars and amino acids in the nucleus of the solitary tract of type 1 taste receptor double-knockout mice.J Neurophysiol. 2020 Feb 1;123(2):843-859. doi: 10.1152/jn.00584.2019. Epub 2020 Jan 8. J Neurophysiol. 2020. PMID: 31913749 Free PMC article.
-
Different functional roles of T1R subunits in the heteromeric taste receptors.Proc Natl Acad Sci U S A. 2004 Sep 28;101(39):14258-63. doi: 10.1073/pnas.0404384101. Epub 2004 Sep 7. Proc Natl Acad Sci U S A. 2004. PMID: 15353592 Free PMC article.
-
Taste information derived from T1R-expressing taste cells in mice.Biochem J. 2016 Mar 1;473(5):525-36. doi: 10.1042/BJ20151015. Biochem J. 2016. PMID: 26912569 Review.
-
The functional role of the T1R family of receptors in sweet taste and feeding.Physiol Behav. 2011 Nov 30;105(1):14-26. doi: 10.1016/j.physbeh.2011.02.030. Epub 2011 Mar 2. Physiol Behav. 2011. PMID: 21376068 Free PMC article. Review.
Cited by
-
The Role of Post-Ingestive Feedback in the Development of an Enhanced Appetite for the Orosensory Properties of Glucose over Fructose in Rats.Nutrients. 2020 Mar 18;12(3):807. doi: 10.3390/nu12030807. Nutrients. 2020. PMID: 32197514 Free PMC article.
-
Exogenous oral application of PYY and exendin-4 impacts upon taste-related behavior and taste perception in wild-type mice.Neuropharmacology. 2025 Jul 1;272:110408. doi: 10.1016/j.neuropharm.2025.110408. Epub 2025 Mar 12. Neuropharmacology. 2025. PMID: 40086622
-
The elusive cephalic phase insulin response: triggers, mechanisms, and functions.Physiol Rev. 2023 Apr 1;103(2):1423-1485. doi: 10.1152/physrev.00025.2022. Epub 2022 Nov 24. Physiol Rev. 2023. PMID: 36422994 Free PMC article. Review.
-
Effect of early-life stress or fluoxetine exposure on later-life conditioned taste aversion learning in Sprague-Dawley rats.Neurosci Lett. 2022 Sep 14;787:136818. doi: 10.1016/j.neulet.2022.136818. Epub 2022 Aug 2. Neurosci Lett. 2022. PMID: 35931277 Free PMC article.
-
Greater superficial petrosal nerve transection in rats does not change unconditioned licking responses to putatively sweet taste stimuli.Chem Senses. 2008 Oct;33(8):709-23. doi: 10.1093/chemse/bjn039. Epub 2008 Jul 16. Chem Senses. 2008. PMID: 18635557 Free PMC article.
References
-
- Bartoshuk LM. Bitter taste of saccharin related to the genetic ability to taste the bitter substance 6-n-propylthiouracil. Science. 1979;205:934–935. - PubMed
Publication types
MeSH terms
Substances
Grants and funding
LinkOut - more resources
Full Text Sources